The Breakeven Win Rate Is Not 50%
Where the 50% figure comes from
Ask most traders what win rate a strategy needs and the answer is “about half”. That number is correct for exactly one payoff: a target the same distance away as the stop. Move the target and the required win rate moves with it, which is why two strategies that both print 65% can be completely different businesses.
The identity behind the ladder
Expected value per trade, measured in units of risk (R), is:
EV = (1 + R) × (win rate − 1 / (1 + R))
The bracket on the right is the whole story. The term 1 / (1 + R) is the win rate at which the strategy makes nothing at all. Below it, no amount of discipline saves the account. Above it, every extra point of win rate is worth (1 + R) times as much as it would be at 1R.
The breakeven ladder
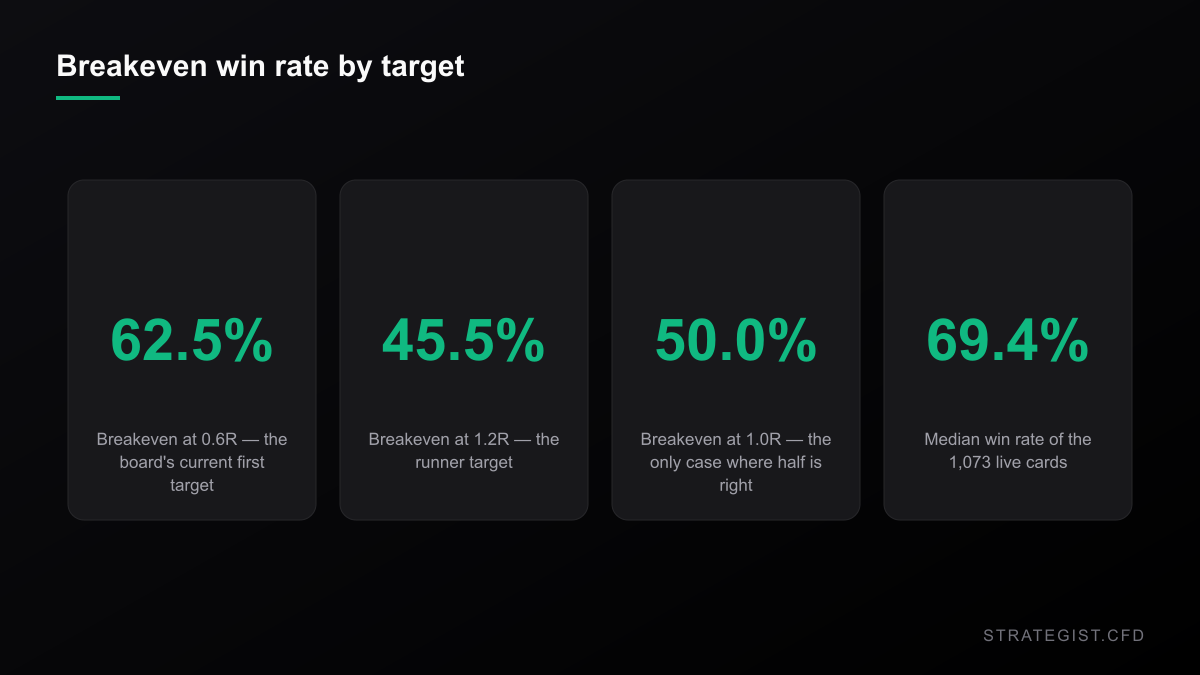
Feed a few targets into the formula and “50%” falls apart:
| Target | Breakeven win rate |
|---|---|
| 0.6R | 62.5% |
| 1.0R | 50.0% |
| 1.2R | 45.5% |
| 1.5R | 40.0% |
| 2.0R | 33.3% |
| 3.0R | 25.0% |
A 3R strategy that wins one trade in three is exactly break-even. A 0.6R strategy that wins one trade in three is losing money at a steady, boring rate. The same 33% win rate produces opposite outcomes — the only difference is where the target sits.
What the live board actually shows
The pattern-analysis board is a useful test case because it publishes its own win rate rather than quoting somebody else’s. As of this run it carries 1,073 live cards across 350 instruments and six timeframes (daily, 4-hour, 2-hour, hourly, 30-minute, 15-minute). The median historical win rate is 69.4% and the mean is 70.7%.
That number is not free-standing. Every card is scored under one exit rule: the first target sits at 0.6R, and half the position is held for a 1.2R runner. Change the rule and the win rate changes — which is exactly the trap the next section describes.
Why you cannot read across the ladder
The temptation is to take the 69.4% and compare it with the 45.5% breakeven of a 1.2R target, then declare the edge enormous. That comparison is invalid. The 69.4% was measured under the 0.6R exit. The only clean comparison on that table is the one directly beside it: 69.4% against the 62.5% breakeven of the same payoff.
To claim the 1.2R row you would need the win rate the same signals produce once the first target is genuinely moved to 1.2R — and that number is lower, because a further target is reached less often. This is the most common way a win-rate table lies: the denominator changes while the numerator is held fixed.
The margin, and what the split exit does
What you should carry in your head is the margin: win rate minus breakeven rate. At the current exit that is 69.4% − 62.5% = +6.9 percentage points. That is a real edge, and a modest one.
The split exit is what makes it more interesting than it looks. Holding half the position to 1.2R lifts the average payoff above 0.6R, which pulls the effective breakeven below 62.5% without touching a single entry signal. The same 69.4% therefore buys a wider margin than a flat 0.6R exit would — the improvement comes from the payoff side of the identity, not from picking better setups.
What it costs to collect
None of this survives contact with a retail account unless the edge clears the cost of holding the position. On the board, the median expected gross margin per card — average R multiplied by the stop distance as a percentage of price — is roughly 0.05% of price. A round-trip spread plus a few days of overnight financing can eat most of that on a currency pair, which is why the board’s edge is concentrated in indices, commodities and crypto rather than in the 77% of cards that are FX.
Caveat. Everything above is descriptive statistics computed from the site’s own published signal data on 2026-09-29. It is not a backtest and not a strategy. The win rates are historical and in-sample; the cost figures are assumptions, not broker quotes; no live account and no funded track record is being claimed. Treat the ladder as a way to size your expectations, not as a promise about the next trade.