The Gold Rule of Thumb Says $4,000. The Market Says $4,321.
What Kitco said on Friday, and why it is worth testing
On Friday, Kitco News ran a piece built around an unusually precise claim. By almost every traditional correlation, gold should be substantially lower than it is: the Federal Reserve is tightening, the dollar is strengthening, and the 10-year Treasury yield has surged to around 5.2%, its highest level in 20 years. Kitco cited World Gold Council modelling that every 25-basis-point increase in the 10-year yield translates into roughly a 1.75% decline in gold. With yields where they are, the argument goes, gold should be well below $4,000 an ounce. Instead it is holding around $4,300.
That is a testable claim, and the interesting part is not the conclusion — it is the number. "1.75% per 25bp" is a slope. A slope is not a price. So I took the claim literally and ran it against 26 years of daily data.
Friday's close, in numbers
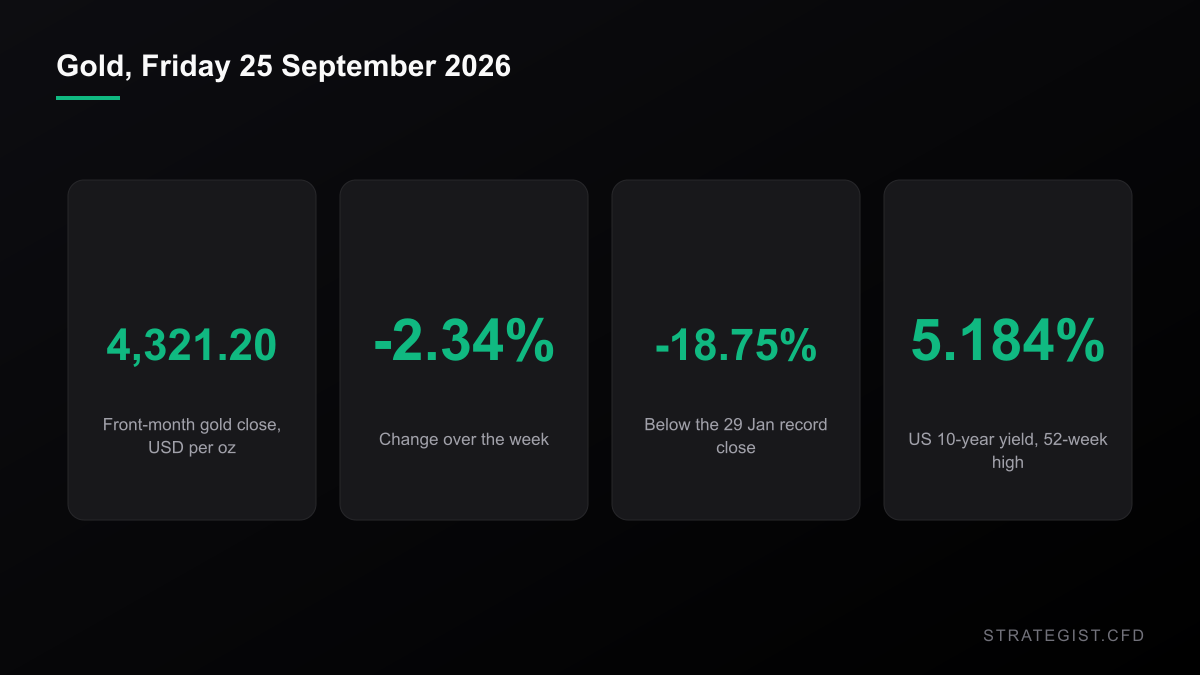
Front-month COMEX gold, daily closes, Yahoo Finance continuous series:
- $4,321.20 on Friday, September 25.
- -2.34% for the week, down from $4,424.90 the previous Friday.
- -18.75% from the record close of $5,318.40 set on January 29, 2026.
- -0.46% year to date. That is not a typo: gold is flat in 2026 after +64.4% in 2025 and +27.5% in 2024. Its 2026 closing range runs from $3,992.10 to $5,318.40.
- The 10-year yield closed at 5.184%, a 52-week high. On the day gold set its record the 10-year was 4.251%, so yields are +93bp higher since.
Both halves of the story are real. Yields went up a lot, and gold is well off its high — it just is not anywhere near where the rule says it should be.
A slope is not a price
Apply the rule of thumb and you get a number. Apply it from a different starting date and you get a different number, which is the entire problem.
Take January 2, 2026 as the baseline. Gold closed at $4,329.60 and the 10-year at 4.187%. Since then the 10-year has risen 100bp. At -1.75% per 25bp the rule says gold should be down 7.0%, or $4,027. Gold is 7.3% above that. This is the version of the story Kitco is telling, and as far as it goes it is accurate.
Now take January 29, 2026 — the day of the record. Gold closed at $5,318.40, the 10-year at 4.227%. Since then the 10-year has risen 96bp. The same rule says gold should be down 6.7%, or $4,962. Gold is 12.9% below that. Same rule, same market, a baseline four months older, and the conclusion flips from "gold is inexplicably strong" to "gold is inexplicably cheap".
Push the baseline back further and it gets worse. From January 2, 2020, when gold was $1,525 and the 10-year was 1.882%, the 330bp rise in yields implies a 23.1% decline and a gold price of $1,172. Gold has quadrupled instead.
The rule is not wrong. It is under-specified. It measures how much a change in yields should move gold; it cannot tell you where gold belongs, because that depends entirely on which day you decided gold was fairly valued. Anyone who quotes a level out of a sensitivity is quietly importing a baseline, and the baseline is doing all the work. The same question — level, or path? — was the subject of the September piece on gold into the Fed decision
Gold Is Testing $4,300 Into a Fed Hike Almost Nobody Doubts
Gold has slid for three weeks and is pressing the $4,300 level into a September 16 Fed decision that Goldman and JPMorgan now expect to be a hike. Here is what that actually means for a leveraged CFD book.
I tested the slope on 26 years of daily bars
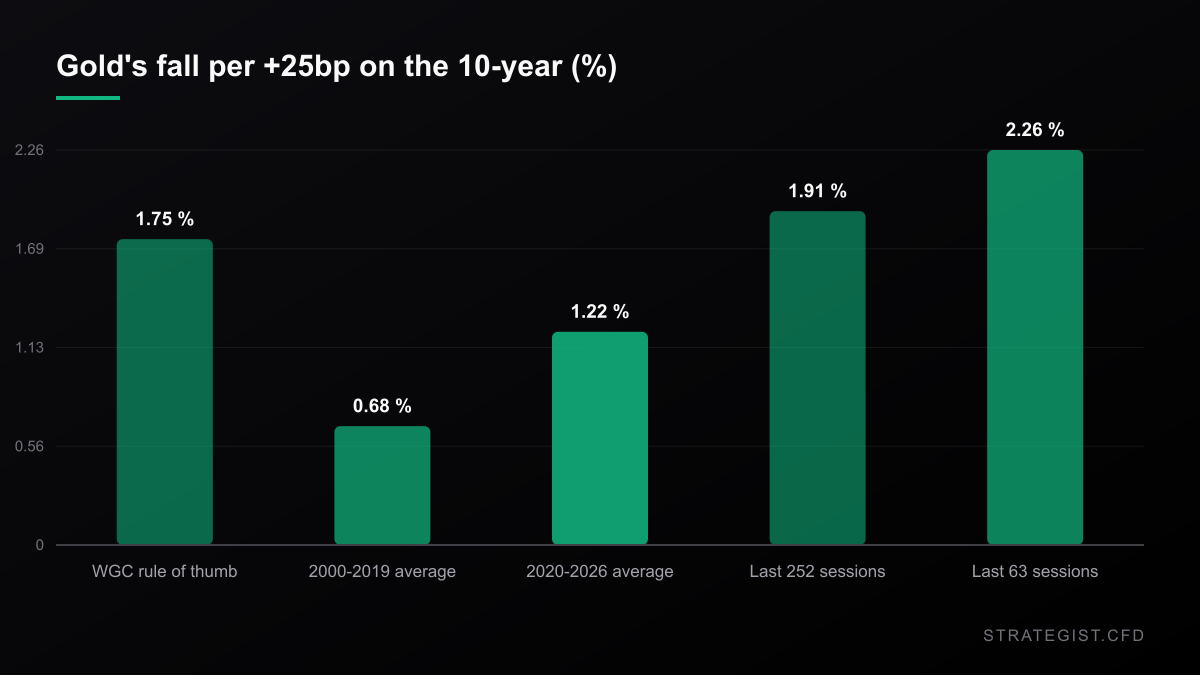
Method: 6,543 daily closes for front-month COMEX gold (2000-08-30 to 2026-09-25) and 6,717 closes for the 10-year yield index, aligned to 6,531 common sessions. I regressed gold's daily percentage return on the 10-year's daily change in basis points, then expressed the slope per +25bp so it is directly comparable with the claim.
- 2000-2019: -0.68% per +25bp (n = 4,839, r = -0.14)
- 2020-2026: -1.22% per +25bp (n = 1,691, r = -0.24)
- Last 252 sessions: -1.91% per +25bp (r = -0.17)
- Last 63 sessions: -2.26% per +25bp (r = -0.28)
- Full 26 years: -0.83% per +25bp (r = -0.17)
Two things fall out of that. First, the World Gold Council's -1.75% is roughly double gold's 26-year average sensitivity — anyone who used that rule since 2000 would have systematically overstated the damage. Second, and more useful: the rule has only recently become right. The trailing-year slope is -1.91% and the trailing-quarter slope is -2.26%, so gold's sensitivity has roughly doubled in the past year. The problem is not that the rule is wrong now. It is that it was never stable.
The caveat matters more than either point. r = -0.17 means the 10-year explains roughly 3% of gold's daily variance. Whatever moves gold on any given day is, overwhelmingly, something else.
What happens on the days the 10Y actually jumps
A slope estimated over 26 years says nothing about the shape of the response. So I isolated the sessions that matter: days when the 10-year yield rose by 10bp or more. There were 288 of them.
- Same session: gold averaged -0.42% and closed higher only 33.3% of the time. On all other days it averaged +0.07% and closed higher 53.4% of the time.
- Next session: +0.01%, higher 53.5% of the time. Base rate: +0.05%, higher 52.5%. Indistinguishable.
- Five sessions later: +0.34% against a base rate of +0.24%, higher 55.7% against 55.6%. Indistinguishable.
Loosening the threshold to +5bp, which gives 1,022 sessions, changes nothing but the magnitude: -0.26% on the day, higher only 39.3% of the time, nothing measurable afterwards.
The yield shock is a same-session repricing. It does not persist and it does not reverse — which is exactly why a stop parked at a fixed distance from price gets harvested on days like those. Over 6,469 rolling 63-session windows since 2000, the correlation between gold's daily return and the 10-year's daily change has ranged from -0.73 to +0.42 and has been positive in 18.6% of them. It is -0.28 right now.
The other betas doubled, and one of them is why the hedge failed
The yield sensitivity is not the only relationship that changed. Measured on daily returns:
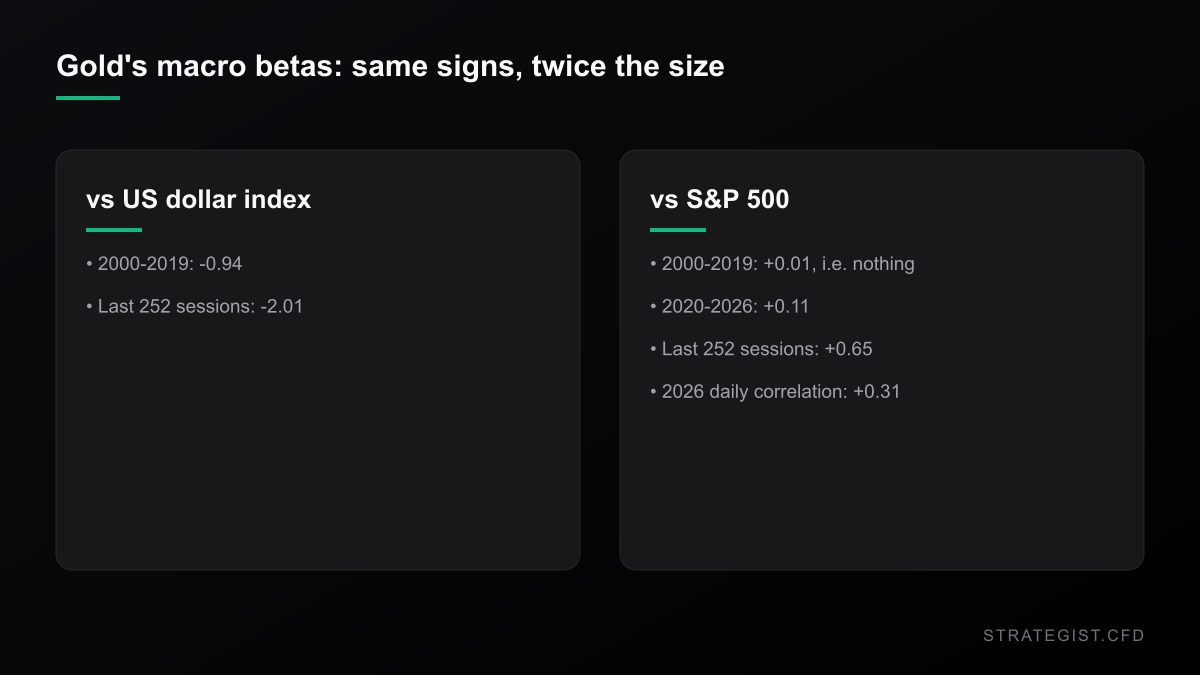
- Gold against the dollar index: beta -0.94 in 2000-2019, and -2.01 over the last 252 sessions. Same direction, twice the size.
- Gold against the S&P 500: beta +0.006 in 2000-2019, effectively zero, then +0.114 in 2020-2026, then +0.649 over the last 252 sessions. In 2026 alone the daily correlation is +0.31 with a beta of +0.71.
That last line is the one to sit with. On the eight worst S&P sessions of 2026, gold averaged -1.03%. June 5: the S&P fell 2.64%, gold fell 3.10%. March 26: S&P -1.74%, gold -3.87%. June 10: S&P -1.62%, gold -3.57%. Year to date the S&P is +13.12% and gold is -0.46%.
If you were holding gold as insurance against an equity drawdown, you bought insurance that fell with the thing it was insuring. A correlation of +0.31 is not a hedge — it is a second position in the same trade with a different ticker. Before you add it to a book,
Correlation Matrix
Analyze the statistical relationship between different assets to avoid over-exposure.
What the retail CFD structure does to all of it
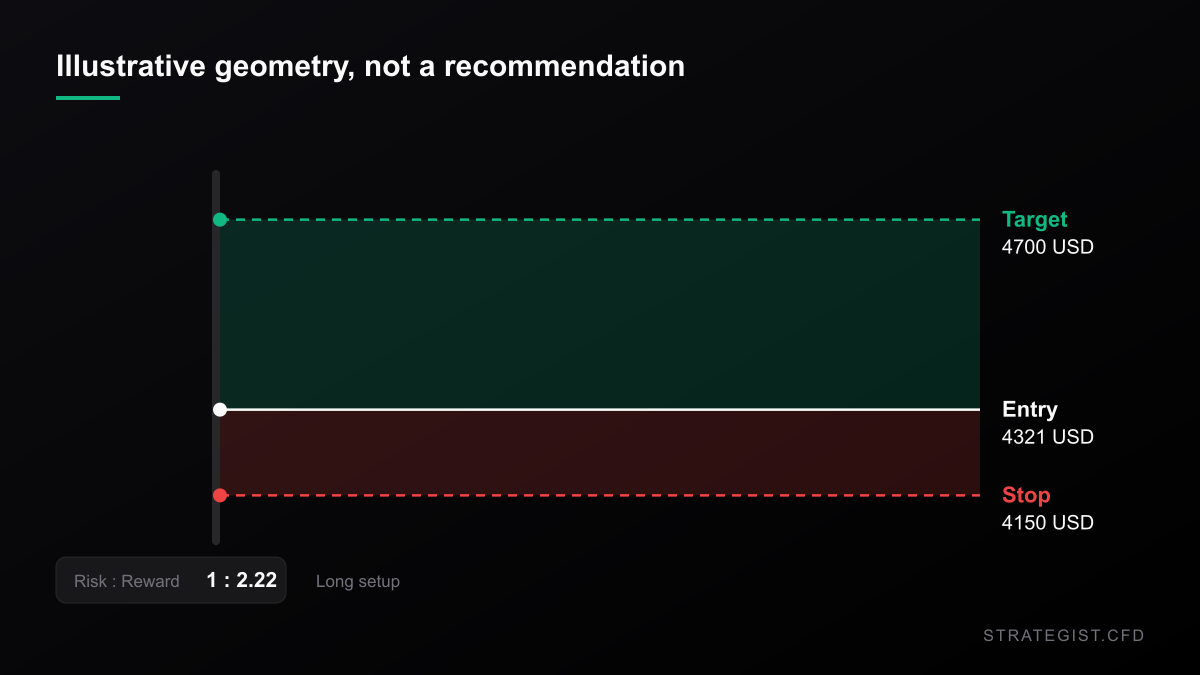
Everything above is about the metal. A leveraged retail position has a second P&L that runs whether or not you are right about direction.
Financing: the 13-week Treasury bill closed Friday at 4.070%. Add the 2% markup typical of retail gold CFDs and a long position costs roughly 6.07% of notional a year at 1x, 12.14% at 2x, 30.35% at 5x and 60.70% at 10x of your equity. It is the same arithmetic as the long-end carry problem I worked through in the
The 10-Year Is at a 2007 High. The Carry Is the Trade.
The 10-year Treasury closed at 5.184%, the highest since July 2007 — and the S&P still finished the week up 1.21% with the VIX under 15. The stock-bond correlation has flipped sign since 2007, and the part of that which is not a forecast is the carry: it eats a forex setup's 0.6R target in about thirteen days.
Now put the financing next to the drawdown record. Since 2000, gold has spent 164 separate episodes below a previous record close. Only four of those went deeper than 20%:
- May 2006 to September 2007: -21.9%, 495 days to recover
- March 2008 to September 2009: -29.7%, 541 days
- August 2011 to July 2020: -44.4%, 3,257 days
- August 2020 to December 2023: -21.2%, 1,211 days
The median recovery time of those four is 1,211 sessions, or 3.3 years. Over 3.3 years, 1x financing at 6.07% costs about 20.1% of notional, the same order of magnitude as the drawdown itself. At 5x the same window costs roughly 100.7% of your equity. A leveraged long that enters before a typical 20% drawdown is liquidated by the financing schedule before the metal gets back to where it started. The drawdown does not have to finish the position. The calendar does.
Then the structural costs. Hedging the equity exposure instead of the gold position means paying margin and financing on two legs at once. Futures-based gold CFDs roll, and the roll is a cost you do not control. Spreads widen exactly when ranges widen. And gap risk is not theoretical: the record close on January 29 came with a 9.19% intraday range, and the next session gold lost 10.78% inside a 16.43% range. A stop 5% away did not exist that day — the market opened through it. Sizing has to survive that, and
Risk Analyzer
Quantify event-specific risks and calculate potential impact on your portfolio.
Sizing when a normal day is 2.43%
Gold's realised volatility in 2026 is running at a 1.89% daily standard deviation, against 1.33% in 2025. The median 20-session intraday range is 2.43%, against a 10-year median of 1.17% — roughly double, and the 89th percentile of the past five years, which have run from 0.72% to 4.49%.
That has a direct consequence. Position size is set by the stop distance, the stop distance has to be set by the range, and the range has doubled. A gold position sized off 2024 volatility is now about half the size it should be — or, if you kept the size, you quietly doubled your risk without changing a single number on the ticket.
The equity proxies are not a clean way around it. Year to date, GDX is +8.28%, Newmont +21.61% and Agnico Eagle +14.72%, against gold itself at -0.46% and GLD at -0.73%. That looks like leverage to the metal. Some of it is. But with gold's beta to the S&P at +0.65, a meaningful part of those returns is simply equity beta — and a mining CFD carries the same overnight financing, plus single-name risk, plus an equity market doing the same thing at the same time.
What I actually ran, and what it does not say
- Source: Yahoo Finance daily closes for front-month COMEX gold (GC=F), the 10-year Treasury yield index (^TNX), the dollar index (DX-Y.NYB), the 13-week Treasury bill (^IRX) and the S&P 500 (^GSPC), 2000-08-30 to 2026-09-25. Every statistic in this article was computed by me from those series.
- What these numbers are: descriptive statistics on one historical sample. They are not a backtest and not a strategy. The regressions are contemporaneous same-day relationships with no execution assumptions, no costs and no slippage.
- Series versus spot: a continuous futures series is not the spot price. Kitco reported spot printing a low of $4,254 on Friday; the front-month futures series I used bottomed at $4,289.20. I use the series for shape — percentages, ratios, distributions — and do not mix its absolute levels with reported spot quotes in the same sentence.
- Weak is the point: r = -0.17 is a real relationship that explains about 3% of daily variance. Anything built on a signal that weak has to be carried by risk management, not by the signal.
- The counter-argument I cannot test: Kitco's actual point — that a 5% yield means something different when federal debt is above $40 trillion and each percentage point of average borrowing cost is roughly $400bn of annual interest — may well be the real story. I cannot put a number on it from price data, so I am not going to pretend I did.
- Nothing here is a live account, a funded track record or a verified backtest. No such claim is being made, and none of this is investment advice.
More in News
 News2026-09-26
Copper Set a Record High While 696,000 Tonnes Sat in New Orleans
Three-month copper came within $92 of its record while Shanghai cathode stocks fell to a three-year low and Comex warehouses held 69% of all exchange metal. The tightness is real — it is just not where the chart is. And the breakout trade that paid from 2000 to 2019 has not paid since 2020.
 News2026-09-21
European Gas Storage Is at 69%. The Price Just Fell 7% — and Both Are True
TTF broke below EUR80 on Monday while EU storage sat 16 points under its five-year average. An inverted curve pays utilities not to fill up, so the two facts aren't in conflict — they're the same fact.
 News2026-09-20
Wells Fargo Cut Its S&P 500 Target to 7,700. The Market Is at 7,650.
Three firms now publish three different year-end targets for the same index — 7,700, 7,900 and 8,200 — and all three sit above Friday's close. The disagreement isn't the signal; the path is.