Copper Set a Record High While 696,000 Tonnes Sat in New Orleans
Copper finished the week about 2% below its own record high. That is the least interesting fact about it. What matters is where the record was set, and where the metal is actually sitting.
What actually happened this week
Three-month copper on the London Metal Exchange settled at $14,783 a tonne on Tuesday 22 September, up 0.8% — a sixth straight gain and the longest run in four months, per Shanghai Metals Market data reported by OilPrice.com. That left it $92 short of the $14,875 record set on 10 September. Comex copper for December delivery traded up to $6.871 a pound in the same session, within two cents of its $6.8885 record settlement from 9 September.
The metal is up roughly 18% on the LME this year, about 21% on Comex, and around 70% from the April 2025 lows.
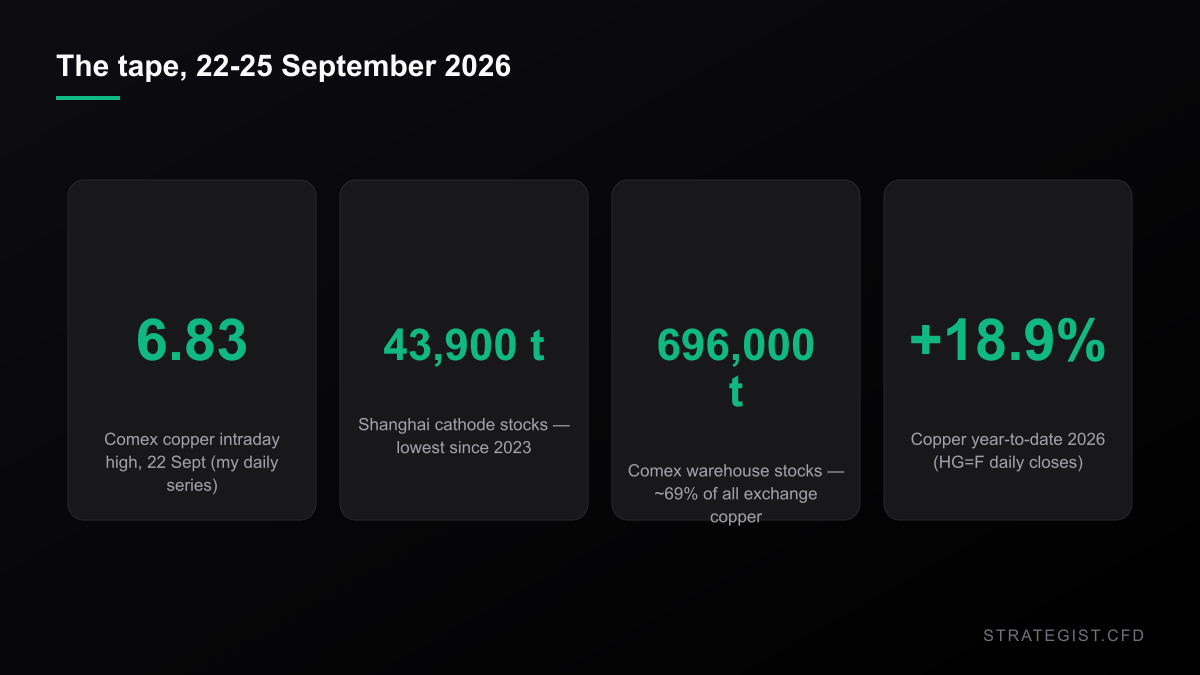
For this piece I pulled the Comex copper continuous series from Yahoo Finance: daily bars, 30 August 2000 to 25 September 2026. On that series copper rose 41.2% in 2025 and 18.9% this year, printing an intraday high of 6.8300 on 22 September and closing the week at 6.6955. Absolute levels on that feed run about 1% under the record prints above, so I use it for shape only — percentages, ratios and distributions — never mixing the two on one line.
The tightness is real, and it is in China
The move to the record was not a Washington trade. It was a physical one. Shanghai copper cathode stocks fell to 43,900 tonnes, the lowest since 2023, and Shanghai Futures Exchange inventories are down about 70% since early June. Cargoes that do land are going straight to fabricators rather than into storage. Spot cathode in Shanghai was commanding an average premium of 1,375 yuan a tonne over SHFE futures on Tuesday — up 550 yuan in a single day.
London tells the same story from a different angle. Cash copper settled at a $62 premium to the three-month contract on Monday, flipping from an $86 discount a week earlier. That is backwardation: buyers want metal now rather than later. Cancelled warrants — metal already booked for withdrawal — climbed to 122,150 tonnes, close to half of all on-warrant stock, leaving only about 133,725 tonnes genuinely available.
Some of that is calendar rather than scarcity: Chinese buyers were front-loading ahead of the Mid-Autumn Festival and the 1–7 October National Day break, and several refineries have maintenance scheduled for October and November. Seasonal restocking in a market this tight still moves the price, but it is not a permanent bid — which is why the next ten days matter more than the last ten.
Meanwhile, 696,000 tonnes sit in New Orleans
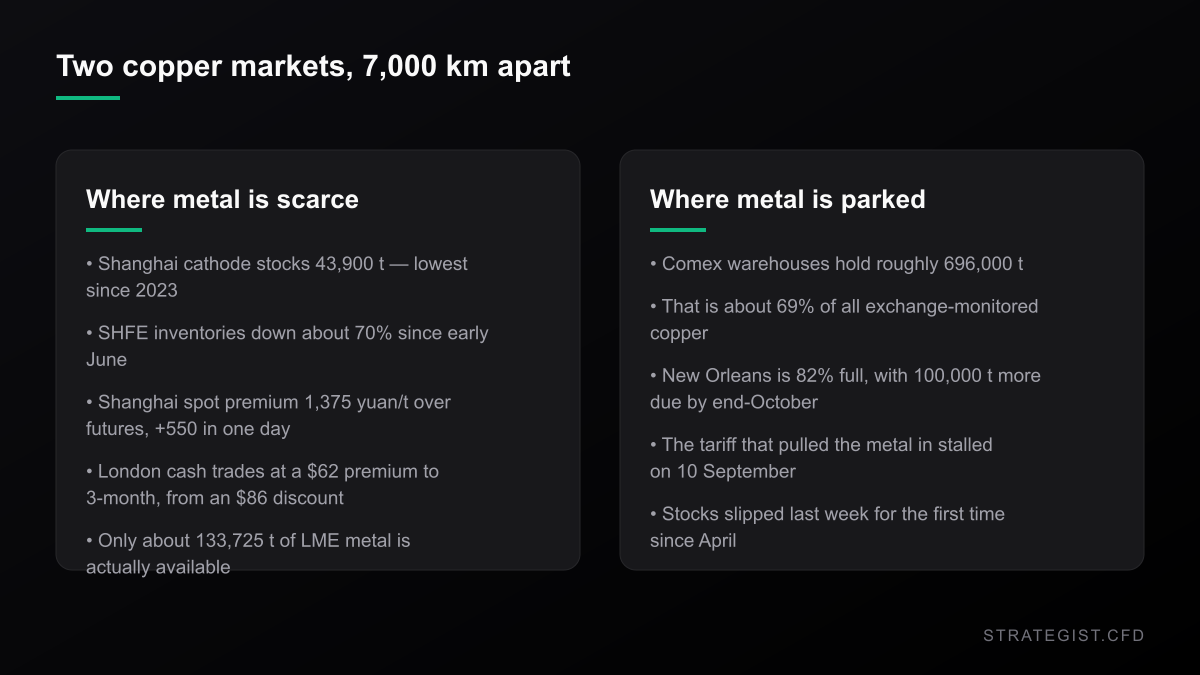
Comex warehouses hold roughly 696,000 tonnes — about 69% of all exchange-monitored copper in the world. New Orleans, the main Comex delivery point, is 82% full, with another 100,000 tonnes due to arrive by the end of October. That stock slipped last week for the first time since April.
It got there because importers spent a year rushing metal into the United States ahead of a tariff that has not materialised. On 10 September, Reuters reported that the White House copper tariff plan had stalled over affordability concerns. The December contract gave back just under 5% in that one session on my series; trade coverage rounded it to “more than 5%”. Either way it was the biggest single-day repricing of the year — and it happened on a policy headline, not on supply or demand.
That is the structural oddity. The world's tightest copper market and the world's largest copper stockpile are 7,000 kilometres apart, and the tariff that would justify moving metal between them is on hold.
The ratio nobody quotes
Now the part the record-high headlines skip. Divide the copper price by the gold price and you get a number sitting at the 7.7th percentile since August 2000 — 0.00155 on 25 September, against a 2000–2026 median of 0.00230 and a 2026 range of 0.00110 to 0.00160.
Read that carefully, because the headline version of it would mislead. A 7.7th percentile since 2000 is driven by the 2000–2011 era: the ratio spent 69.6% of sessions above 0.0025 before 2012 and only 4.8% of them since. Measured against the last five years alone, the same reading is at the 29.6th percentile. Copper is cheap against gold, but it is not at an unprecedented extreme.
What the ratio captures is a handoff. Gold ran +64.4% in 2025 and has gone nowhere in 2026: −0.46% year-to-date and 22.7% below its 29 January peak of $5,586.20. Copper ran +41.2% in 2025 and added another 18.9% this year. The debasement trade stalled; the metal with an actual use case did not.
One caveat for anyone using the ratio as a growth signal: over the last 252 sessions, daily percentage changes in it correlate −0.03 with daily changes in the 10-year Treasury yield. That is zero.
Correlation Matrix
Analyze the statistical relationship between different assets to avoid over-exposure.
I tested the breakout
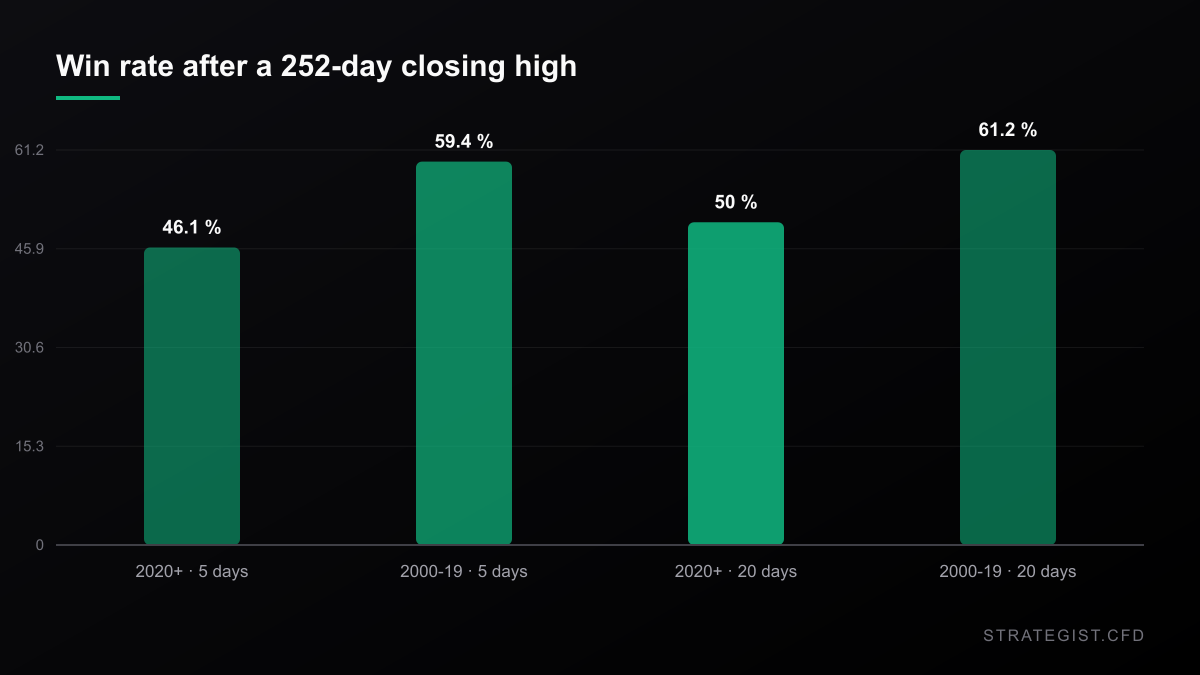
The reflex trade in a metal printing all-time highs is to buy the breakout. So I measured it. Using the same Yahoo Finance series I flagged every session since August 2000 whose close was a new 252-session closing high — 295 events — then looked at what the metal did afterwards. One event definition, one dataset, no optimised parameters, no lookahead.
Across the full sample the breakout did pay. Five days later the mean return was +0.51% with a 55.9% win rate, against a baseline of +0.25% and 53.4% for all days. Twenty days later, +2.95% versus +1.02%. Sixty days later, +8.16% versus +3.23%. A real, persistent tilt — the kind of thing you would build a system on.
Then I split the sample at 2020, and the tilt disappeared.
For the 76 events since 2020 the mean five-day return is −0.17% with a 46.1% win rate. Twenty days out: −0.31% mean, +0.11% median, 50.0% win rate. For the 219 events before 2020: +0.74% and 59.4% at five days, +4.06% and 61.2% at twenty.
Two caveats before anyone builds anything on this. First, 76 events is a small sample, and a 46% win rate on 76 observations is not statistically distinguishable from 50%. The defensible statement is narrower and still useful: the breakout edge that existed from 2000 to 2019 is not visible in the post-2020 data. Second, this is descriptive statistics on a price series — not a backtest. It has no execution model, no costs and no position sizing, and it is not a strategy.
The miners are not the metal
Year-to-date, Freeport-McMoRan is +42.8% and Southern Copper +42.8%, against +18.9% for the metal itself. The Global X Copper Miners ETF is +19.6%; gold, via GLD, is −3.6%; the S&P 500 is +12.6%.
So the two purest large-cap producers have moved about 2.3 times the metal. Equity leverage cuts both ways and always has: an Escondida strike headline, a cost surprise, a tax change in Chile, and the same 2.3x works against you.
What a retail copper CFD actually is
Here is where the structure stops being academic. A “copper” position on a retail platform is almost always a cash-settled contract on one specific futures price, and the first question is which one. Comex December versus LME three-month is not a detail: different delivery points, different currencies, different tax treatment and, right now, a visible spread driven entirely by US trade policy. If you do not know which contract your symbol tracks, you do not know what you own. Three costs stack on top:
- Roll. Cash-settled CFDs roll the underlying, and the roll is priced into your entry and exit rather than billed separately. In a backwardated market — which is what London is showing — a long pays to roll. That is the same information as the $62 cash premium, arriving as a cost instead of a headline.
- Financing. Copper CFDs are margined, so the notional carries an overnight charge. The Fed hiked a quarter point on 16 September, its first increase since 2023, and the 10-year yield is at 5.18%. Higher short rates raise the carry on every leveraged long.
- Spread and session gaps. Comex copper trades roughly 23 hours a day, which sounds like an advantage until you notice the news does not. The 10 September tariff headline took just under 5% out of the contract in one session; the Escondida accident and the union's refusal to pause talks both broke outside US hours.
The 10-Year Is at a 2007 High. The Carry Is the Trade.
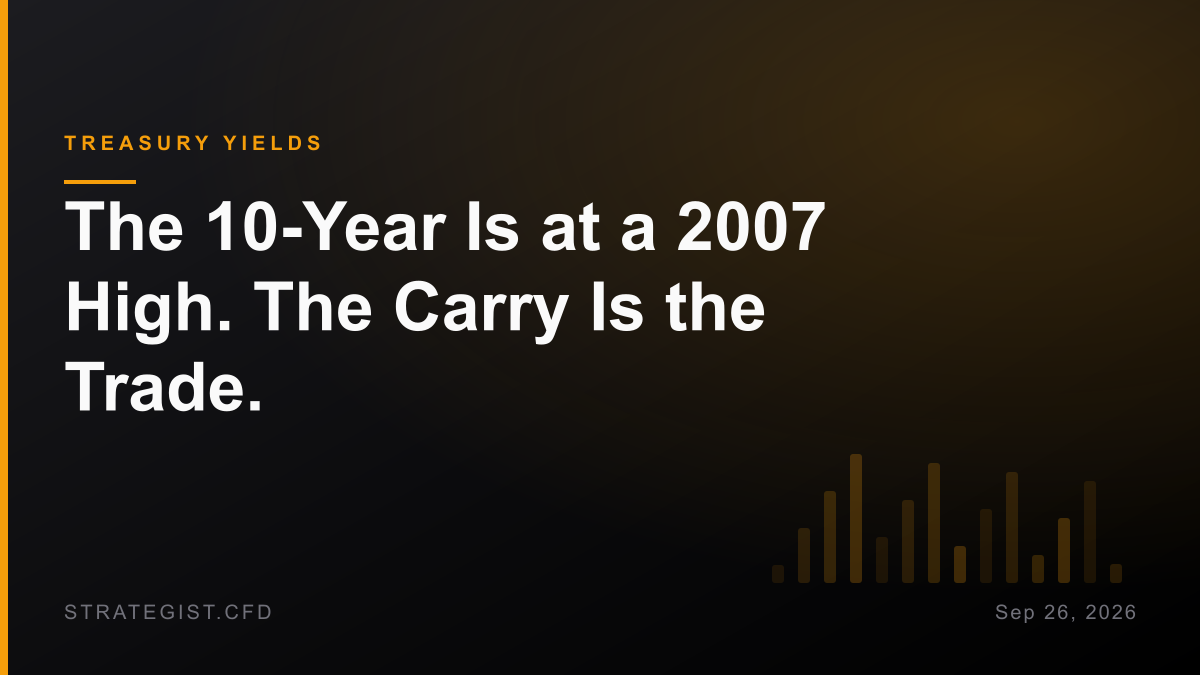
The 10-year Treasury closed at 5.184%, the highest since July 2007 — and the S&P still finished the week up 1.21% with the VIX under 15. The stock-bond correlation has flipped sign since 2007, and the part of that which is not a forecast is the carry: it eats a forex setup's 0.6R target in about thirteen days.
Sizing when a normal day is 1.25%
Over the last 20 sessions the median Comex copper session has a high-low range of 1.25% of price, with the widest at 4.81%. The ten-year median is 1.15%, so current volatility is unremarkable — this is just what copper does. The median absolute close-to-close move is 0.99%. A normal day in a major FX pair is a fraction of that, which is why a stop distance copied from a EUR/USD setup gets hit by noise here.
The metal is also stretched: the 25 September close sits 10.0% above its 200-day moving average, the 77th percentile of the last five years' distribution. Not an extreme — the five-year maximum is +31.0% — but not a coiled spring either.
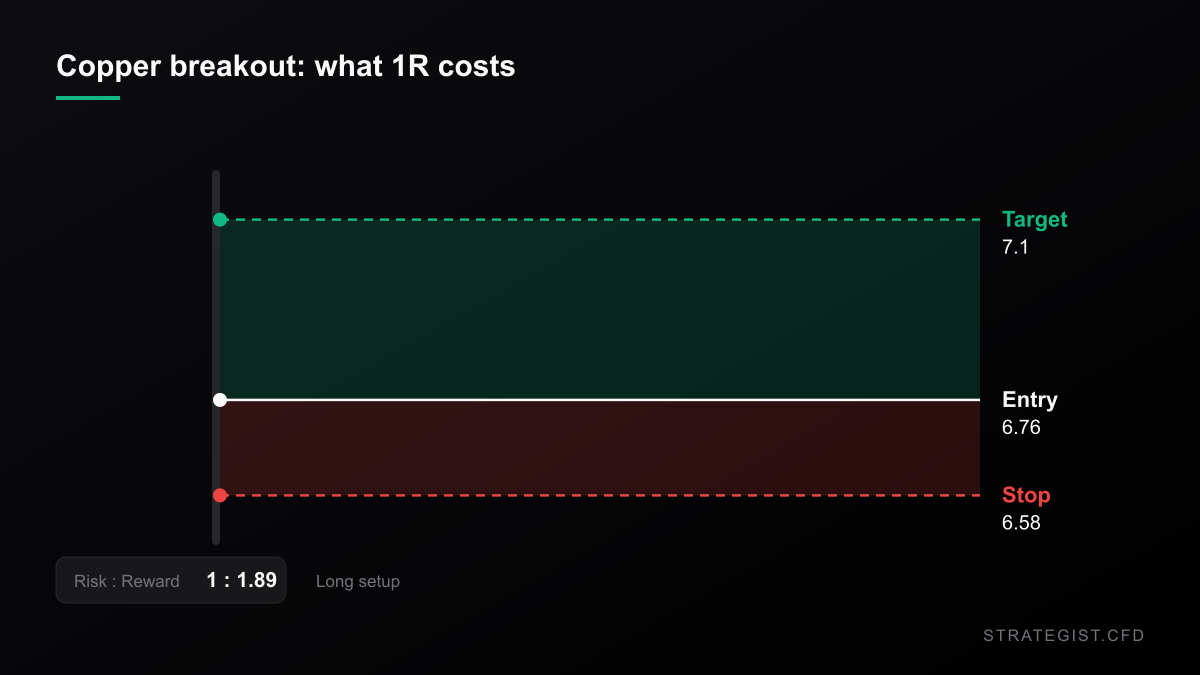
Here is the arithmetic, not a recommendation. Buy the 22 September breakout close at 6.76, stop at 6.58 (below the 17–18 September base, about 2.1 normal daily ranges away), target 7.10 — the 10 September shakeout range projected from the breakout. That is 1R = 0.18, or 2.7% of price, and reward-to-risk of about 1:1.9.
Note what the sizing does not do: it does not care whether the breakout works. Given the post-2020 numbers above, the honest prior is that it might not. Sizing is what keeps a wrong prior survivable.
Risk Analyzer
Quantify event-specific risks and calculate potential impact on your portfolio.
Why Position Sizing Matters More Than Entry Signals
Entry signals decide where you trade; position sizing decides whether you survive. Why capital allocation dominates entry precision in leveraged CFD markets, and how to build a sizing rule you can actually follow.
What would change my mind, and what I am not claiming
The bear case. The tariff could be finalised — bullish Comex, bearish everywhere else — or abandoned, in which case the metal parked in New Orleans becomes exportable supply and the US premium collapses. A 696,000-tonne pile is a very large amount of optionality sitting in a warehouse.
The bull case. Global mined output may fall this year for the first time since 2017, with Grasberg and Kamoa-Kakula outages stripping about 600,000 tonnes from expected 2026 production. The 2026 benchmark treatment and refining charge settled at zero dollars a tonne — the lowest on record, down from $21.25 in 2025 and $80 in 2024 — and spot rates went negative: a concentrate market telling you the constraint sits at the mine, not the smelter. And Escondida, the world's largest copper mine, has a contract expiring on 30 September. The supervisors' union urged rejection of BHP's offer, a fatal accident shut the mine, the union refused to pause talks, and operations are only gradually resuming.
The timing trap. Chinese markets are shut for the Mid-Autumn Festival and again from 1 to 7 October, so the marginal buyer that drove this leg higher is absent for a week. The Trump–Xi summit closed on 25 September with few announced achievements, so no policy catalyst replaces it.
What I am not claiming. I do not run a live account and I have no funded track record. The forward-return numbers above are descriptive statistics I computed from daily bars — not a backtest, not a strategy, with no costs, slippage or execution model. The record levels for the LME and the December Comex contract are quoted from published trade coverage with dates attached, and my own series differs from them by about 1%. Where I could not verify a number I left it out rather than soften it.
More in News
 News2026-09-27
The Gold Rule of Thumb Says $4,000. The Market Says $4,321.
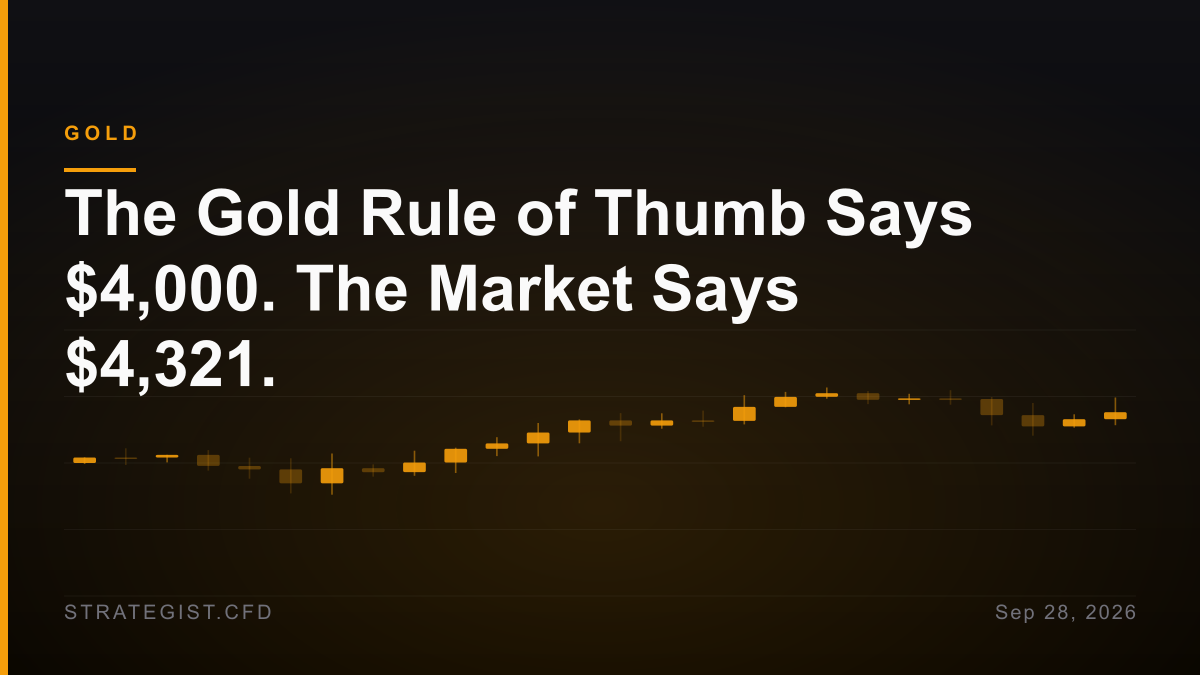
Kitco's rule of thumb says a 5.18% ten-year yield should have gold well below $4,000. I ran that number against 26 years of daily bars. The slope was never stable — and gold's beta to the S&P is now +0.65, which is why the hedge stopped hedging.
 News2026-09-21
European Gas Storage Is at 69%. The Price Just Fell 7% — and Both Are True
TTF broke below EUR80 on Monday while EU storage sat 16 points under its five-year average. An inverted curve pays utilities not to fill up, so the two facts aren't in conflict — they're the same fact.
 News2026-09-20
Wells Fargo Cut Its S&P 500 Target to 7,700. The Market Is at 7,650.
Three firms now publish three different year-end targets for the same index — 7,700, 7,900 and 8,200 — and all three sit above Friday's close. The disagreement isn't the signal; the path is.