European Gas Storage Is at 69%. The Price Just Fell 7% — and Both Are True
Monday's tape: gas down hard, storage unchanged
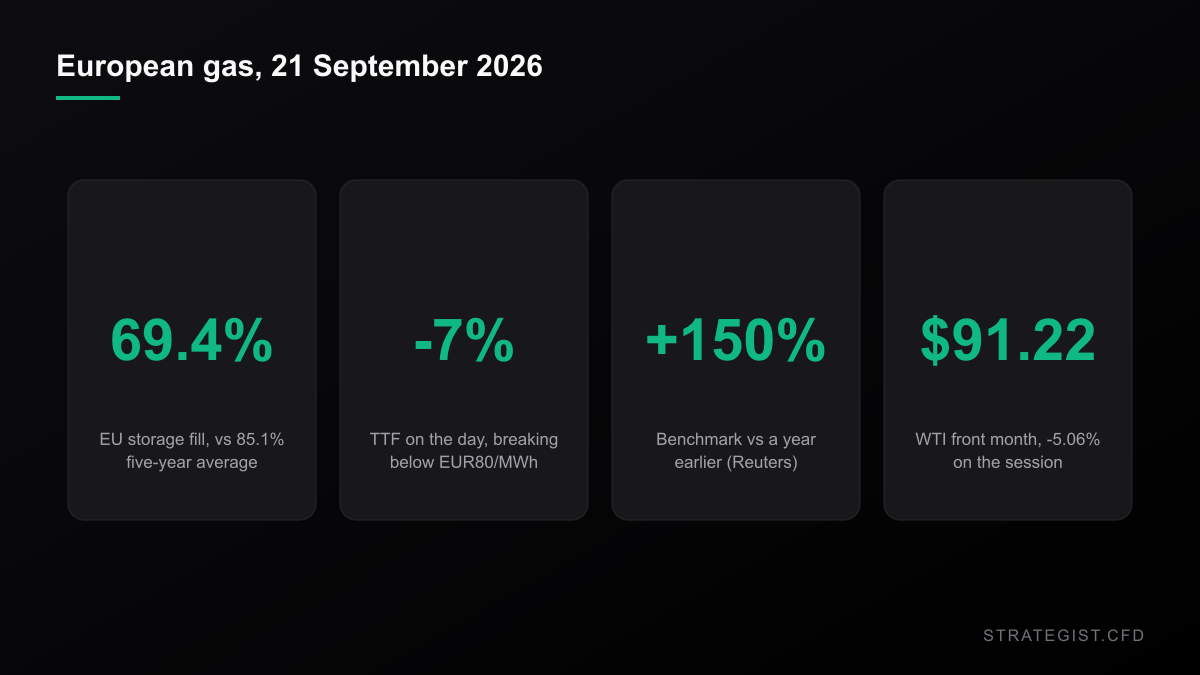
On the same day the benchmark Dutch TTF contract broke below EUR80/MWh — a drop TradingView put at around 7% — European gas storage stood at 69.4% full. The five-year average for that date is 85.1%. A year ago it was 81.6%.
Read those two sentences quickly and they look like a contradiction: a market with a supply deficit, selling off. Read them slowly and they're the same sentence. Price is a flow variable that repriced in a few hours on news out of the Strait of Hormuz and a crude complex that fell 5% in one session — WTI front month at $91.22, down from $100.30 on Friday. Storage is a stock variable that moves in fractions of a percent a week. One tells you what traders think today. The other tells you what Europe has in the ground in February.
Reuters framed the deficit on 17 September: storage at 69% against an 85% five-year norm, with Germany and the Netherlands — a third of the bloc's storage capacity between them — the worst laggards. The benchmark, it noted, was up about 150% year-on-year and already above the ECB's "adverse" scenario. That isn't a market that has priced calm. It's a market that took a day off from pricing panic.
An inverted curve pays you not to store
The deficit keeps widening not because anyone is confused, but because of arithmetic. XTB's Monday read, citing Bloomberg data, had TTF in backwardation — spot above the forward curve. If you're a utility or a state-backed importer, the trade on offer is: buy molecules today at EUR80, inject them, and sell them out of storage in April at whatever the forward says. When the forward sits below spot, that trade loses money by construction.
So commercial buyers hold back. XTB describes importers deliberately withholding part of their purchases in the hope of lower prices, because buying at the local peak means selling at a loss later. Every week they wait, the storage number gets worse. Every week the storage number gets worse, the case for a violent winter repricing gets better — but for the contracts that actually clear in winter, not for the front month on your screen.
This is the bit retail traders misread most often. A low storage figure isn't a buy signal for "gas". It's information about the shape of the curve. The deficit closes when the forward curve rises far enough to make storage profitable again, and not one day before that.
Two scenarios, and they differ by EUR35
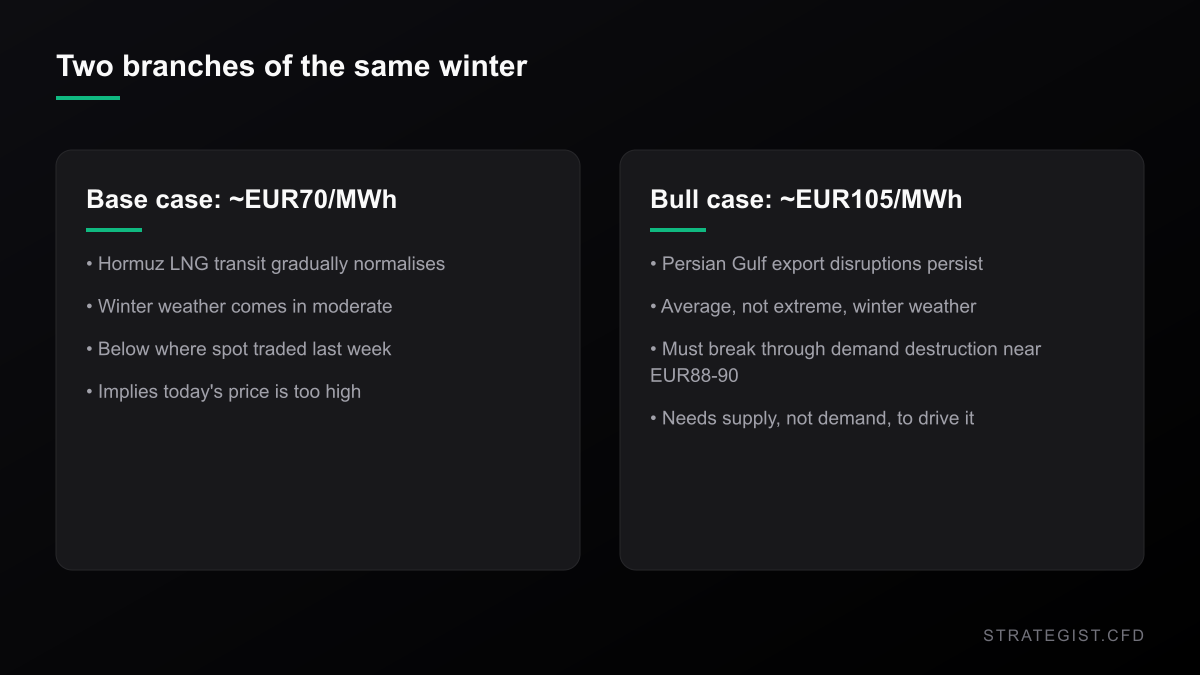
Goldman Sachs put numbers on both branches on Monday. Base case: roughly EUR70/MWh by year-end, assuming LNG transit through Hormuz gradually normalises and winter is moderate. Bull case: EUR105/MWh, if Persian Gulf export disruptions persist through an average winter.
Notice what the base case says. EUR70 is below where spot traded last week. The bank running the EUR105 headline has a base case that says today's price is too high. Morgan Stanley's EUR100 figure, quoted by Reuters, is explicitly weather-conditional. On the other side of the ledger, XTB cited shipping data showing Saudi Arabia moved up to 3 million barrels a day through Hormuz over the past week, and noted that less than 42% of US LNG exports went to Europe — down from more than 50% a month earlier — with cargoes redirected toward Asia and Egypt.
The ceiling sits below the bull target
Goldman also flagged a self-limiting mechanism: above roughly $30/MMBtu — about EUR88–90/MWh — industrial demand starts to break. India curtails gas consumption; China switches to coal on a large scale. So the EUR105 scenario requires the market to punch through a level at which a meaningful chunk of the demand it depends on simply stops buying.
That changes how you should size the upside. A move from EUR78 to EUR90 is a 15% move that runs straight into real demand destruction. A move from EUR90 to EUR105 has to be driven by supply rather than demand, and supply here is a function of one strait and one weather model.
The symbol on your platform probably isn't this market
Here's the practical trap. Nearly every retail CFD platform offers "NATGAS". That contract is Henry Hub, the US benchmark, and it closed Monday at $2.83/MMBtu, down 2.9%, with a 52-week range of $2.48 to $7.83.
TTF, at just under EUR80/MWh, works out to roughly $27/MMBtu on Goldman's own conversion. Henry Hub is $2.83. One is about ten times the other, and it has stayed that way for a while, because the thing that would close the gap — liquefaction and shipping capacity — is finite and slow to build.
So "European storage is low" and "I'm long NATGAS" are not the same trade. They're correlated, weakly and inconsistently, and right now that correlation runs through crude: XTB's point on Monday was that gas has been tracking oil because both are pricing the same Hormuz risk. WTI fell 5.06% on the session. If you were long gas and long oil on Monday, you didn't have two positions. You had one position, twice.
Correlation Matrix
Analyze the statistical relationship between different assets to avoid over-exposure.
What I measured: the range expands, the direction doesn't
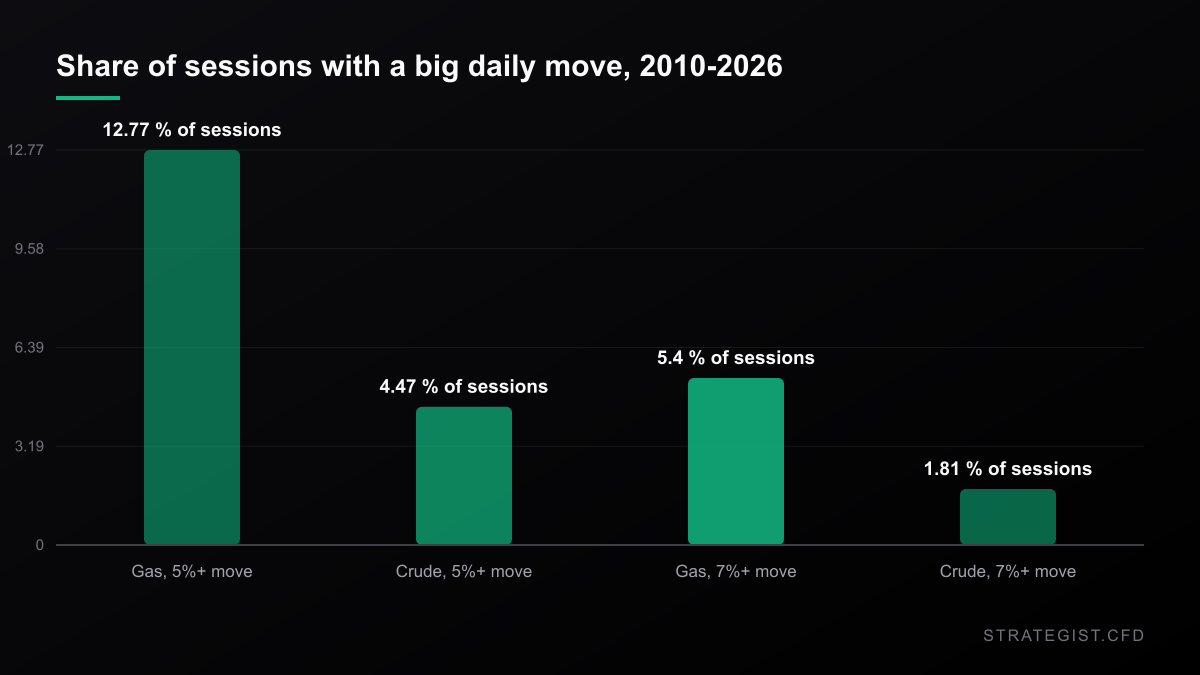
I pulled every daily bar for the front-month US gas contract from 4 January 2010 through Monday — 4,205 sessions — and ran the two things worth knowing before you place a stop anywhere near this market.
First, the volatility isn't comparable to the rest of your book. Daily standard deviation is 3.79%. Days with an absolute move of 5% or more: 537, or 12.8% of all sessions. Days with a 7% move or worse: 227, or 5.4%. Median high-low range is 3.97% and the 90th percentile is 7.78%. For comparison, WTI over the same sixteen years: 4.5% of days move 5% or more, and 1.8% move 7% or more.
Second, I looked at what happens after a 7%-down day. There were 98 of them. The next session's average range was 7.02% against a 4.44% baseline, so volatility clusters hard. But the next session's average return was -0.08% against +0.13% for everything else, and the win rate was 51.0% against 49.9%. Five days out the win rate was 58.2% against 49.2% — the only number in the set that looks like anything, and it rests on 98 observations. Ten days out, the average was -1.23% against +0.06%.
The honest summary: after a crash day, gas gets wider, not directional. If you want to trade the bounce, the range is telling you to cut size, not to add conviction.
I also checked the seasonal story, because "gas goes up in winter" is one of those things people repeat without checking. Across those sixteen years, December's average monthly return in the front-month contract is -0.48%, with 45% of Decembers higher. There's no seasonal edge in this data.
Sizing when a 7% day is ordinary
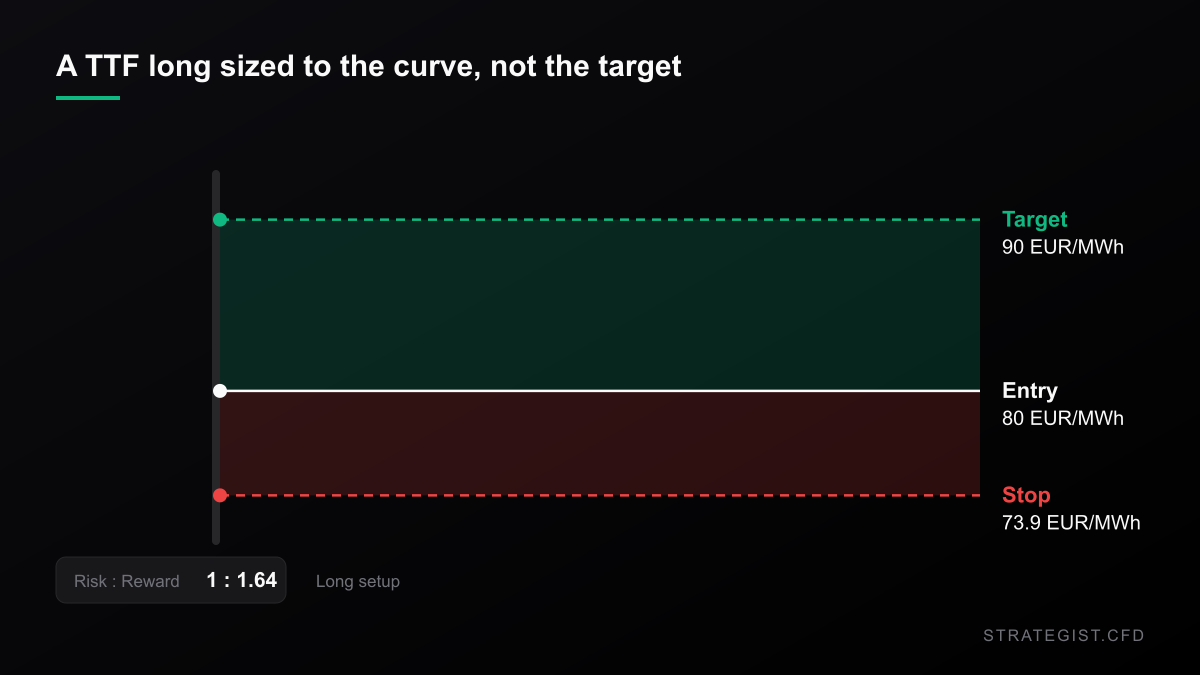
Take a concrete long. Entry at EUR80. Stop below the cluster XTB flagged — the 23.6% retracement at 73.95 and the SMA25 at 72.77 — call it 73.9. Target capped at EUR90, where Goldman says industrial demand starts to break. That's risk of about 6.1 points for a reward of 10, roughly 1.6R.
The version where you hold for EUR105 is a 4.1R trade. It's also a trade that needs Hormuz to stay shut and the weather to cooperate, which isn't a thesis you can attach a probability to — it's a wager on two coin flips.
Now the leverage. That stop is 7.6% away in price terms. If your notional exposure is five times your capital, being stopped out costs you 38% of your account. At ten times, it's 76% — and the daily range figures above say you can be taken out inside one ordinary session. Gas isn't a market where you put the stop wherever it looks tidy. It's a market where the stop distance forces the position size, and that size usually ends up smaller than you wanted.
Then there's the carry. TTF is in backwardation right now, which means a rolling long earns roll yield rather than paying it. That condition can flip. The US market shows what the other side looks like: UNG, the ETF that holds front-month gas futures, has returned -23.2% a year over the last ten years while the continuous front-month price series is -0.8% a year. Over one year it's -15.1% against +0.8%. Part of that gap is fees and cash drag rather than roll alone, but the lesson survives the caveat. Being right about the direction of gas and holding a rolling long through the wrong part of the curve are two different trades, and only one of them pays.
Risk Analyzer
Quantify event-specific risks and calculate potential impact on your portfolio.
Why Position Sizing Matters More Than Entry Signals
Entry signals decide where you trade; position sizing decides whether you survive. Why capital allocation dominates entry precision in leveraged CFD markets, and how to build a sizing rule you can actually follow.
Where this view is wrong
Start with the obvious one: the bull case is consensus. Goldman, Morgan Stanley, Reuters and the ECB are all pointing at the same risk. A consensus view that has already driven the price up 150% year-on-year isn't a contrarian edge, and Monday's 7% drop is a live demonstration of how fast it can de-rate when the headline changes.
Second, the storage percentage is a political metric. The EU's 75% target is a policy number rather than a physical constraint, and 69% of 2026 demand isn't 69% of 2021 demand — European industrial gas consumption has structurally fallen since the 2022 shock. What actually binds in February is withdrawal capacity and LNG import capacity, and neither one shows up in a fill percentage.
Third, my own numbers are American. Henry Hub is not TTF. European gas has different microstructure and, given the geopolitical driver, arguably worse weekend gap risk. The US data tells you what a gas market's volatility distribution looks like; it doesn't tell you what TTF will do.
And the event study is 98 observations. The five-day win rate of 58.2% is exactly the kind of number that survives on a small sample and dies on a larger one. I'd treat the range result — volatility clusters — as solid, and the directional results as noise.
What to do with it
- Check the symbol before you trade the story. Henry Hub is not TTF, and the spread between them is roughly tenfold.
- Don't hold gas and crude as if that's diversification. They're sharing one Hormuz risk premium right now.
- Size off the stop distance, not the target. A 7.6% stop at five times leverage is a 38% account hit.
- After a crash day, expect a wider range rather than a direction. Cut size.
- Cap the target where demand breaks — roughly EUR88–90 — unless you have a specific view on Hormuz.
- Know which way your curve is. Backwardation pays a long to roll; contango bleeds it.
Charts and analysis on this site are for research only and are not investment advice.
More in News
 News2026-09-20
Wells Fargo Cut Its S&P 500 Target to 7,700. The Market Is at 7,650.
Three firms now publish three different year-end targets for the same index — 7,700, 7,900 and 8,200 — and all three sit above Friday's close. The disagreement isn't the signal; the path is.
 News2026-09-19
Bitcoin Reclaimed $80,000 on a Rule Nobody Has Read
The CFTC's crypto filing reached the White House with no published text and no deadline. Bitcoin still jumped 5.9% on Friday. Here's what the filing says, what it doesn't, and how to size around it.
 News2026-09-18
Buffett Gave Up the Chair on Friday. Berkshire's Stock Shrugged — and That's the Tradeable Part
Warren Buffett quit the Berkshire chair after 56 years. The stock opened 0.4% lower and went nowhere. What a non-event actually tells CFD traders about sizing, gap risk and the index exposure you didn't choose.