Buffett Gave Up the Chair on Friday. Berkshire's Stock Shrugged — and That's the Tradeable Part
What actually happened on Friday
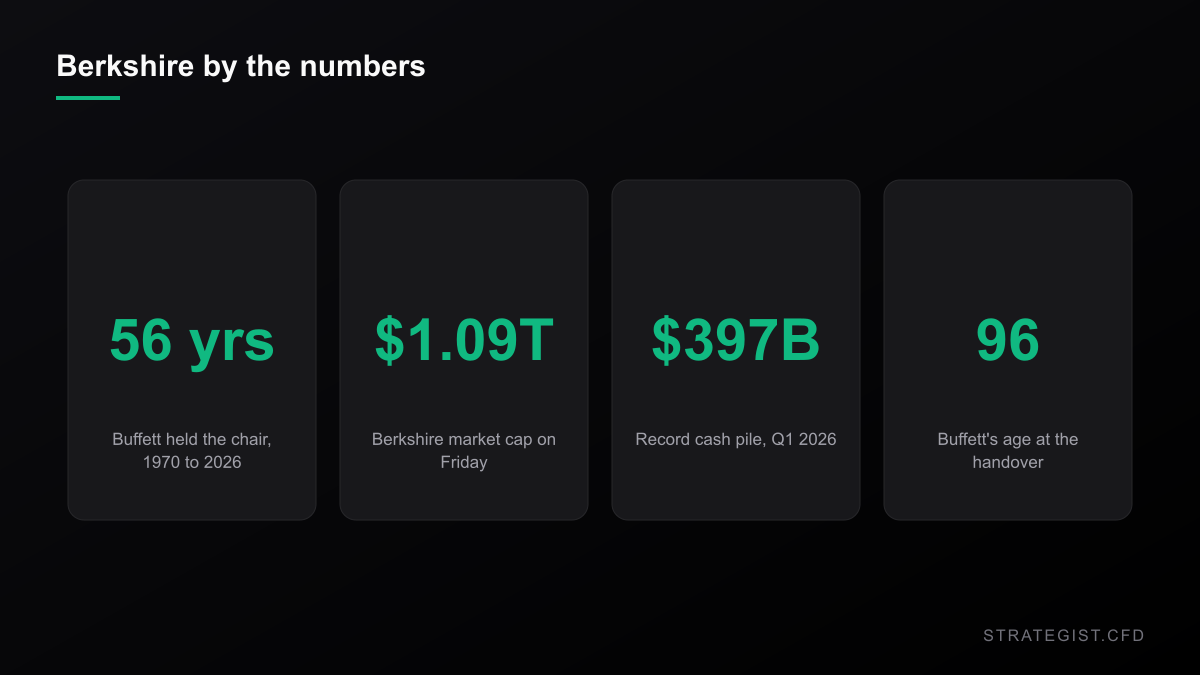
Warren Buffett is 96, and on Friday he gave up the chairman's title at Berkshire Hathaway, a job he had held since 1970. The change took effect immediately. His son Howard was elected chairman; Buffett moves to chairman emeritus. Reuters, the New York Times, Bloomberg and the AP all had it within hours, and CNBC's write-up led with Buffett's own line for the occasion: "Father Time always wins."
None of this changes who runs the money. Greg Abel became CEO on January 1, 2026, nine months ago, after Buffett sketched the plan at the 2025 annual meeting. Friday's handover is governance, not management. The chair runs the board; the CEO allocates the capital.
The scale is worth holding in your head, because it's why this showed up on every tape in the world: Berkshire is a $1.09 trillion company, and Abel inherited a cash pile that hit a record $397 billion in his first quarter as CEO, reported in early May. By August, Reuters had Berkshire shares at their highest since Abel replaced Buffett, helped along by heavier buybacks and a strong earnings print. The market has spent eight months re-rating this company under its new boss already.
The tape's answer was a shrug
Berkshire's B shares closed Thursday at $509.20. On Friday they opened at $507.16, a gap of roughly 0.4%, and by early Friday afternoon in New York they were back at $509.44 — flat on the day. The high-to-low range was 0.67%.
Compare that with the stock's own baseline. Over the previous 20 completed sessions, Berkshire's average daily high-to-low range was 1.08%. Friday was quieter than normal. Volume said the same thing: about 2.7 million shares by mid-afternoon against a 20-session average near 4.1 million. Nobody was in a hurry.
Two honest caveats. Friday's session was still open when this was written, so read the numbers as a snapshot rather than a verdict — the close could look different. And even a full quiet session wouldn't prove much on its own. But the shape of it — small gap, narrow range, light volume — is what an already-telegraphed event with no cash-flow content normally looks like. There was no new number in the headline, so there was nothing to reprice.
The interesting move happened the day before
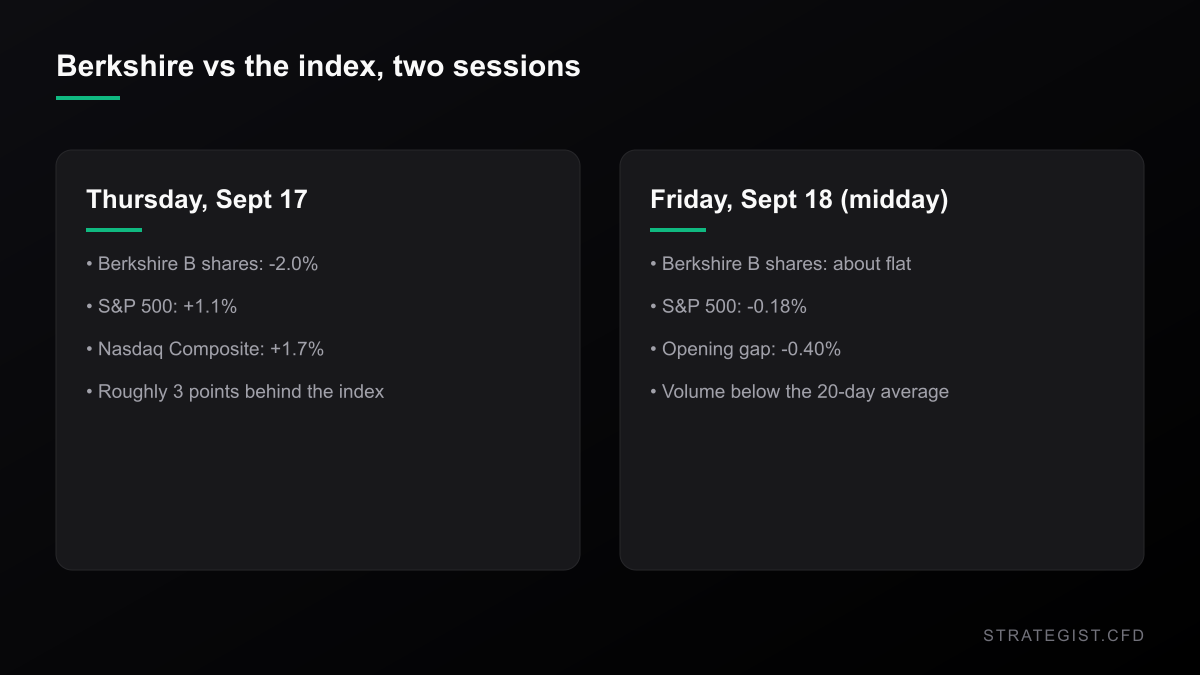
Thursday was the part that should make you sit up. Berkshire's B shares fell 2.0%, from $519.80 to $509.20, on a session where the S&P 500 gained 1.1% and the Nasdaq Composite added 1.7%. That's about three percentage points of underperformance in one day, on one of the index's best sessions of the month.
Why, I genuinely don't know, and I'm not going to invent a reason. What matters for us is what it does to a popular position. A lot of traders hold Berkshire as ballast — the boring, cash-rich, conservatively-run name you park money in while you do something aggressive somewhere else. On Thursday it behaved like the opposite of ballast. Anyone running long Berkshire against a short index as a quality pair took damage on both legs on the single strongest index day of the month.
Low volatility is not low risk
Now the arithmetic that actually bites. With an average daily range of 1.08%, put Berkshire on a CFD at 5:1 and a completely ordinary, news-free session swings roughly 5.4% of your posted margin. Thursday's 2% move at 5:1 is a 10% dent in account equity. You don't need a crash. You need one unremarkable day that happens to go the wrong way.
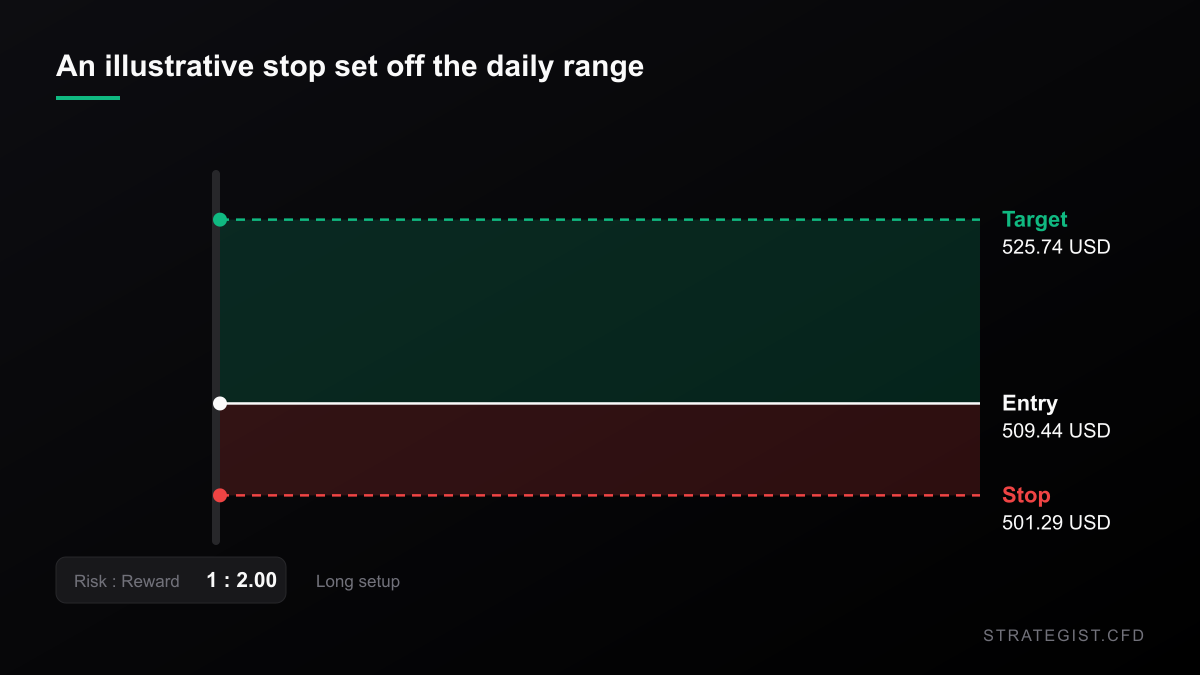
The fix is the boring one, and it's the same fix every time: let the instrument's own range set your stop, then let the stop set your size. A worked example, using Friday's price and nothing else — this is arithmetic, not a tested result. Say you decide in advance to risk 1% of a $10,000 account, which is $100, and you put the stop 1.5 times the average daily range below entry, about 1.6%. Your position size is $100 divided by 0.016, or roughly $6,250 notional. Under 1x leverage on the account. It looks insultingly small next to what the platform will approve, and it's the reason a 2% adverse day costs you $100 rather than $1,000.
What could actually change, and what won't
The chairman does not allocate capital. Every account of Howard Buffett's appointment frames his role around culture and governance — keeping the place recognisably Berkshire. Capital allocation sits with Abel, and Abel has already shown he'll touch things Buffett wouldn't: CNBC reported in January that he flagged the Kraft Heinz stake as possibly on the way out, and August's results came with bigger buybacks and a reduced cash pile.
That tells you where the real event calendar lives. It isn't the headlines — it's the 13F, the 10-Q and the buyback disclosure. Those arrive on dates you can look up in advance, with an actual document attached. If you want a view on Abel's Berkshire, that's where you can define a trade. Trading a succession headline is trading a story with no number in it.
And price the carry while you're at it. The 10-year Treasury yield was back around 5% on Friday — MarketWatch and Investopedia both led with it — which makes overnight financing on a long single-name CFD expensive. Sitting in a position for three weeks hoping a governance narrative resolves is a materially different trade from taking short-dated exposure around a filing.
Where I could be wrong
Most of the above could turn out backwards. Succession effects tend to show up over quarters, not sessions; a "Buffett discount" could build slowly as investors quietly re-price what they thought they owned, and one quiet Friday says nothing about that. My reading of Thursday is the weakest link here — I've described a 2% drop and deliberately refused to explain it, and it's entirely possible the move had nothing to do with succession at all. Low realised volatility is also precisely the condition that gets people to size up right before the regime changes: 60 calm sessions are not evidence about the next 60. If I'd defend any single claim, it's the narrow one. An event with no cash-flow content, announced before the open, is a bad place to be levered.
What to actually do with a succession headline
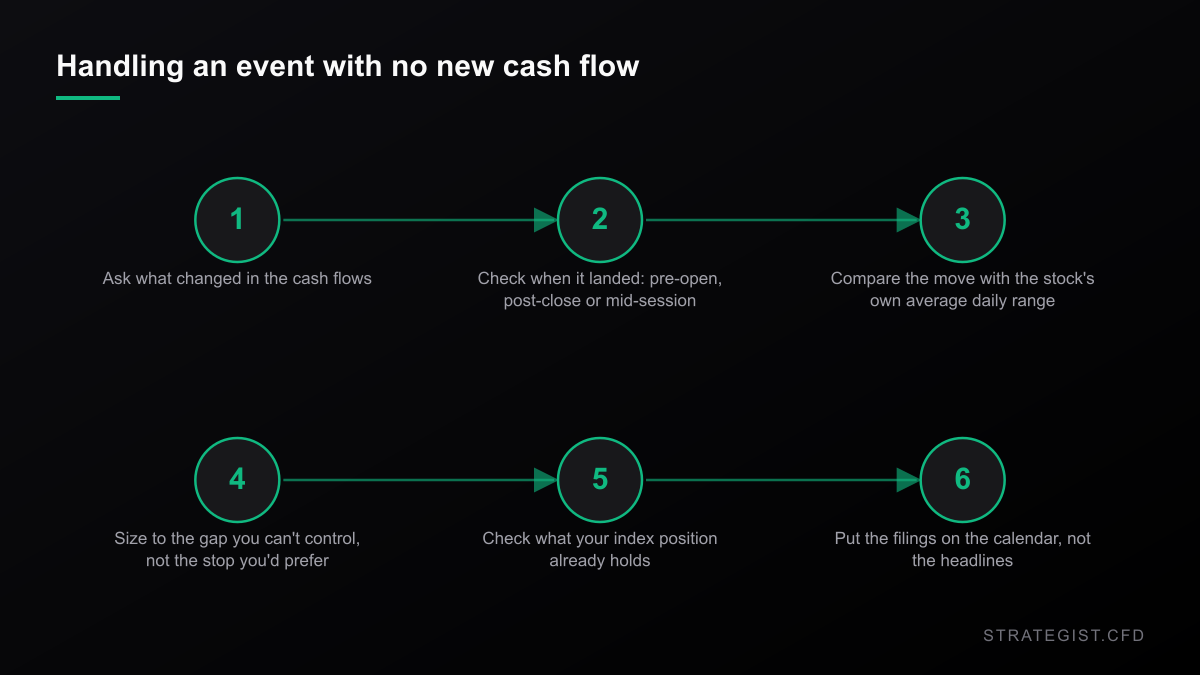
The short version: don't carry leveraged single-name exposure into scheduled corporate events that contain no new information about cash flows. If you have to be in, size to the gap you can't control rather than to the stop you'd prefer. Find out what your index position already owns — a US 500 CFD hands you Berkshire whether or not you've ever read a word about the succession plan. Put filing dates on your calendar instead of headlines. And keep clear in your own head the difference between a trade you can define and a narrative you find interesting.
Where the numbers come from: Berkshire prices, ranges and volumes are daily bars from Yahoo Finance — the same source this site's candle endpoint uses — retrieved on 18 September 2026, with the 20-session average range and the largest recent moves computed from those bars. Index levels are from the same source. The $397 billion cash figure is Berkshire's Q1 2026 result as reported by Fortune, CNN, Bloomberg and Reuters in early May 2026. The position-sizing example is arithmetic, not a backtest.
Charts and analysis on this site are for research only and are not investment advice.
More in News
 News2026-09-19
Bitcoin Reclaimed $80,000 on a Rule Nobody Has Read
The CFTC's crypto filing reached the White House with no published text and no deadline. Bitcoin still jumped 5.9% on Friday. Here's what the filing says, what it doesn't, and how to size around it.
 News2026-09-17
The SEC Cleared a Path to 24/7 Stock Trading. Gap Risk Just Moved.
The SEC's five-year Innovation Exemption lets venues trade tokenized U.S. stocks. The headline is 24/7 trading — but the halt rule buried in the order is what leveraged traders should be reading.
 News2026-09-16
It Costs a Record $44.8 Million to Ship US Oil to Asia. Spot Prices Fell Anyway.
Freight printed an all-time high on the same 48 hours the Saudi outage that caused it started to unwind. The cost shock is real; the price signal is not what it looks like.