Wells Fargo Cut Its S&P 500 Target to 7,700. The Market Is at 7,650.
The cut everyone read as bearish
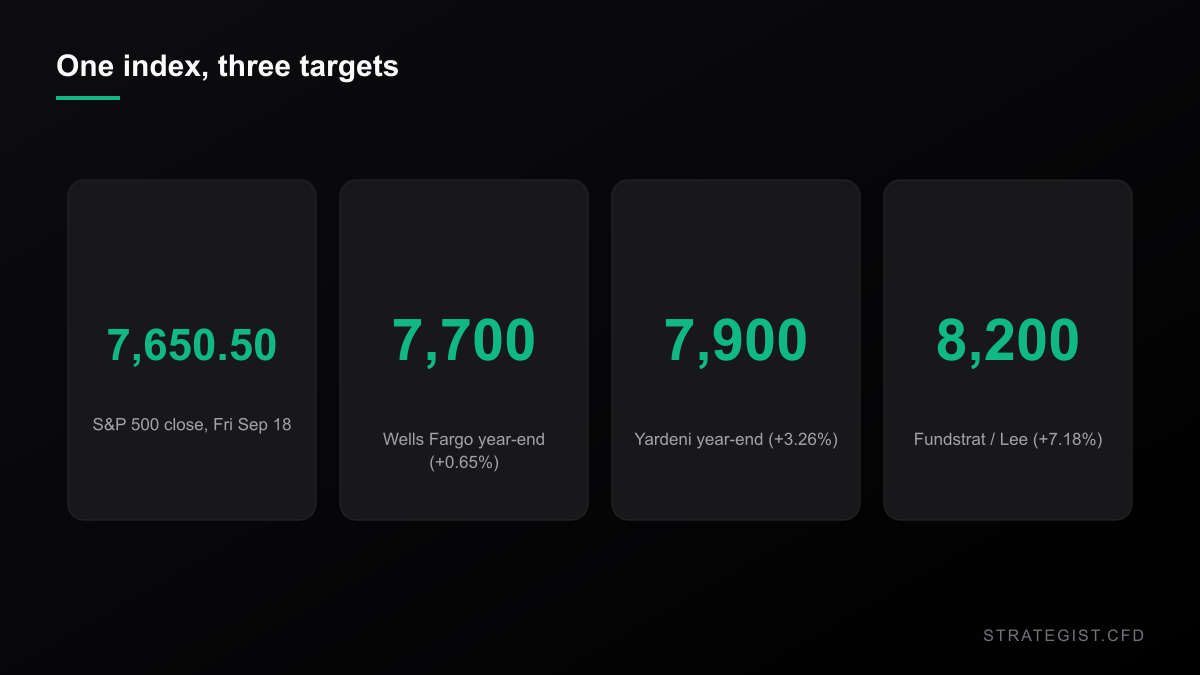
On Tuesday, Sept 15, Wells Fargo trimmed its year-end S&P 500 target to 7,700 and told clients to expect 5%–10% downside first. Reuters carried it, and Seeking Alpha, Investing.com and Bloomberg all had versions within the hour. Bloomberg's headline named the strategist — Ohsung Kwon — and the reason: AI worries building inside big tech. The same note tilted toward healthcare.
A day later Ed Yardeni cut his target to 7,900, telling CNBC to "proceed with caution" as rates rise. Fundstrat's Tom Lee didn't cut at all; he's still calling for something above 8,200.
Here's the part almost nobody led with. The S&P 500 closed Friday at 7,650.50. All three of those numbers — including the bearish one, including the one that arrives with a drawdown warning attached — sit above where the index actually is.
What "5% to 10% downside" actually describes
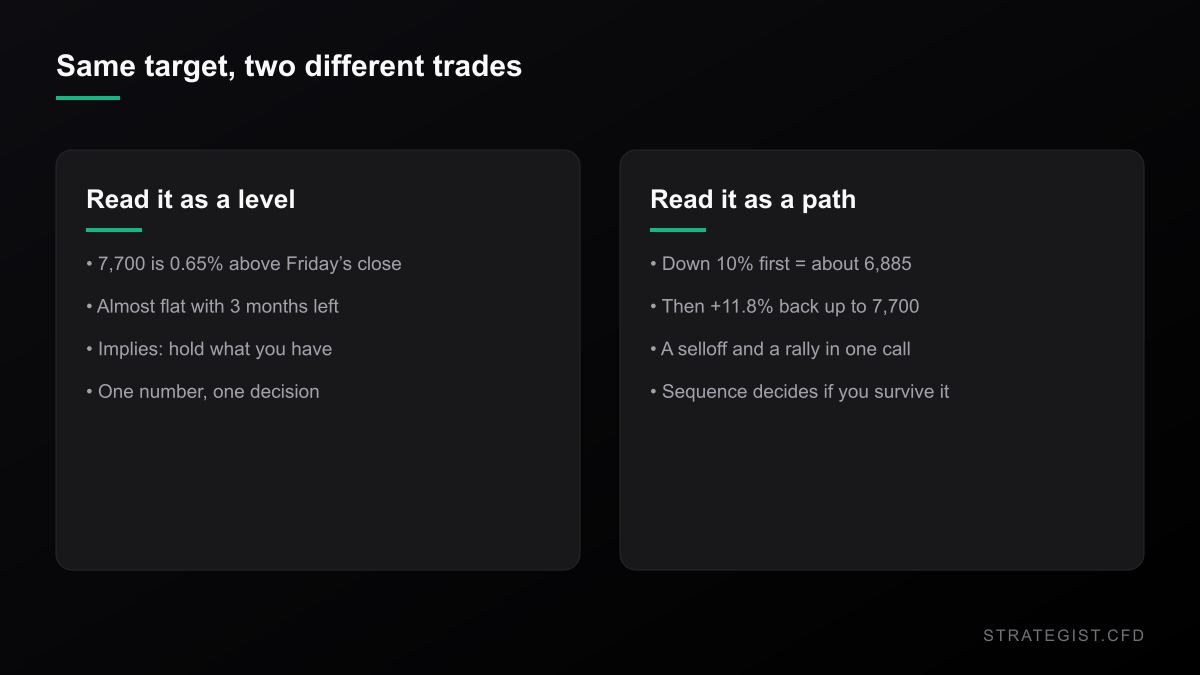
A cut reads as directional. It isn't. Wells Fargo's 7,700 is 0.65% above Friday's close, with about three and a half months left in the year. Yardeni's 7,900 is 3.26% above. Lee's 8,200 is 7.18% above. The low end of the range is still a call for the index to rise.
The drawdown warning is a separate claim, and it's a claim about sequence. If the index falls 10% first and then finishes December at 7,700, it has to travel from roughly 6,885 back up to 7,700 — an 11.8% rally off the low. One year-end number contains a selloff and a rally, in that order. Which of the two you end up trading depends on where you think you are in the sequence, and the target tells you nothing about that.
A 5% drawdown isn't a forecast. It's the calendar.
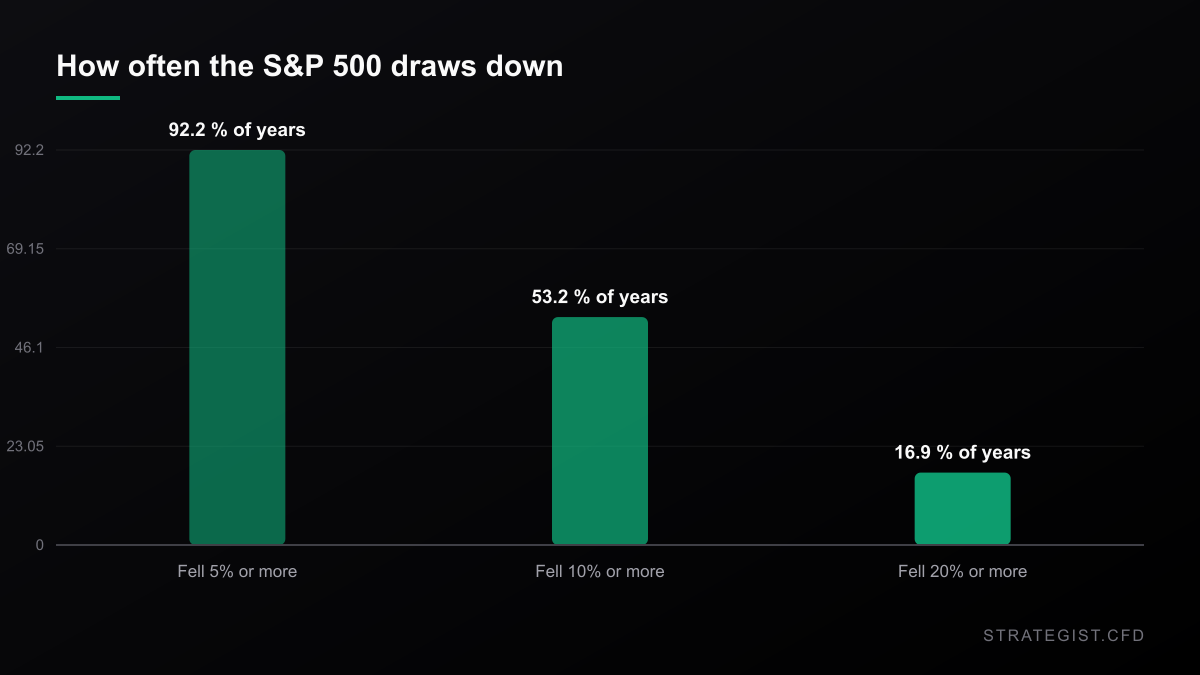
This is where the warning stops being interesting. I pulled daily closes for ^GSPC back to 1950 — 19,300 sessions across 77 calendar years — and measured the deepest peak-to-trough decline inside each year. A drawdown of at least 5% showed up in 71 of those 77 years. One of at least 10% showed up in 41. The median worst-in-year drawdown was 10.3%.
So "we expect a 5%–10% pullback before year-end" translates, more or less, to "we expect a normal year." Narrow it to the modern era and it barely moves: since 2001, 25 of 26 years contained a 5% drawdown somewhere.
The tail is real as well. Thirteen of the 77 years drew down 20% or more — 2008 at 48.0%, 2020 at 33.9%, 1987 at 33.5%. The median is uncomfortable; the tail ends careers. Both are in the same sample.
None of that makes Wells Fargo wrong. It makes the warning cheap. Calling the median outcome isn't an edge — it's a reminder that the median outcome is uncomfortable to sit through.
How to Reduce Drawdowns Without Destroying Expectancy
Cutting drawdowns by tightening stops usually destroys the edge it was meant to protect. A ranked approach to drawdown control — sizing, volatility adjustment, diversification and robustness — that keeps expectancy intact.
Why that matters more if you're levered
An index CFD converts a 10% drawdown from an opinion into a margin question. At 5x, a 10% fall in the S&P takes half the capital you posted. At 10x, the recovery you were right about doesn't happen for you, because you were closed out somewhere near the low.
Carry makes it worse, and the timing is bad for it. The 10-year closed Friday at 5.00%, near the top of its three-month range. If your broker finances long positions at a benchmark plus a markup — the common structure, though the markup is entirely broker-specific and your own schedule is worth reading — you're charged on the full notional, which is a multiple of your equity, for every day you hold. On a "down 10%, then back up" path you pay for the whole round trip.
The move won't announce itself either. Over the last 20 sessions the median daily change in the S&P was 0.46%, with a median high-low range of 0.59%. A 5% drawdown is roughly eight of those days. It doesn't arrive as an event you get to react to; it accumulates while you wait.
And you can't opt out of the part of the index they're worried about. An index CFD hands you the whole basket at whatever weight the index assigns, so you inherit the mega-cap tech exposure Kwon's note is flagging whether or not you have any view on AI. You can cut size. You can't edit the constituents.
Risk Analyzer
Quantify event-specific risks and calculate potential impact on your portfolio.
VIX is at 14.81, and that's the real disagreement
Three well-known shops spent last week publishing downside warnings. The 10-year is at 5.00%. The Dow closed Friday at 51,682.64, down 1.69% on the week — its third straight weekly decline, per Barron's. The S&P is 1.90% below its Aug 13 closing peak of 7,798.99.
And VIX closed Friday at 14.81, near the bottom of a three-month range of 13.80 to 23.34.
Put a number on that. Divide 14.81 by the square root of 252 and you get roughly a 0.93% daily move — about twice the 0.46% median the index actually printed over the last month. The options market is pricing a distribution noticeably wider than what the tape has been doing, and still calls it calm.
One of those two pictures is wrong, and it's worth being honest about which one you're betting on. Either volatility is cheap relative to what these strategists are describing, or the options market is correctly pricing an index that has already done its correcting and is still up 11.76% year to date, from 6,845.50 at the end of 2025.
Buying protection at 14.81 is a coherent trade. Deciding the warnings are noise is also coherent. Holding 5x leverage and calling it a view is not — that isn't a third option, it's the first two with extra steps.
Sizing for the drawdown, not the target
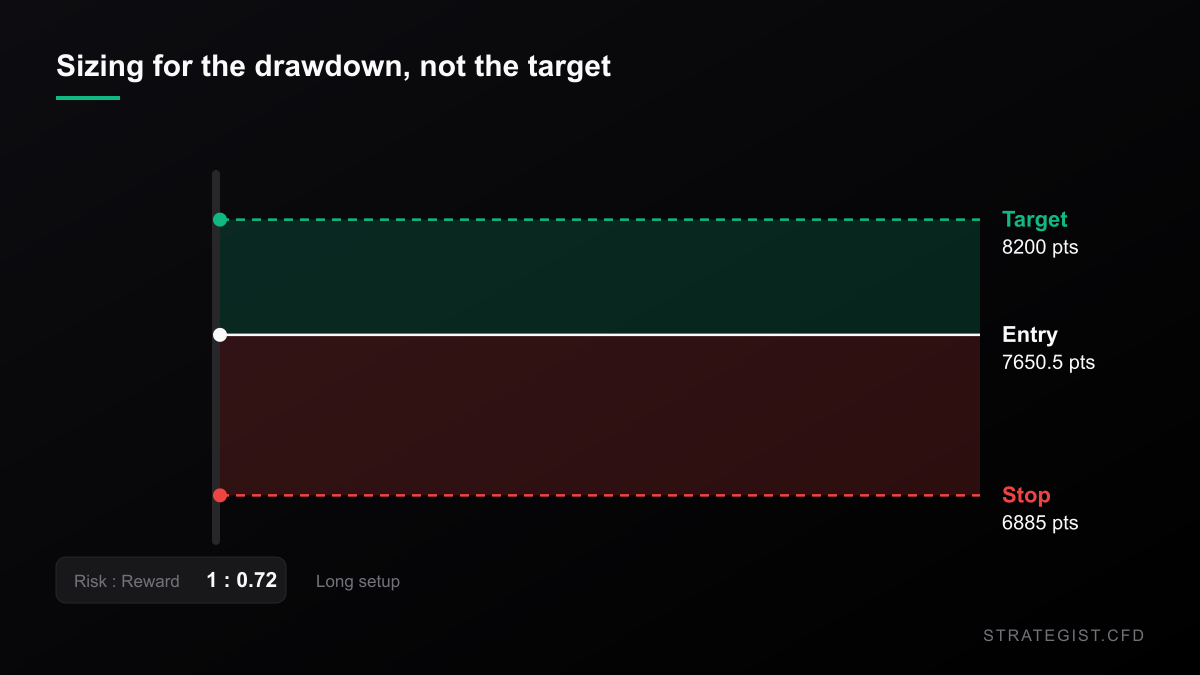
The practical version inverts the usual order. Decide the drawdown you can absorb, let that set your size, and only then ask whether the trade still works. Using Friday's close as a reference entry at 7,650.50: a 10% drawdown lands near 6,885, and the top of the published range is 8,200. You're risking roughly 765 points to make 550.
Reward-to-risk below 1 isn't automatically disqualifying — plenty of trend systems run below 1 and win on hit rate. But it's a bad shape to hold at high leverage through a path you've been warned contains a 10% hole, because you're paying financing to sit in it and there's no cushion if the hole goes deeper.
Why Position Sizing Matters More Than Entry Signals
Entry signals decide where you trade; position sizing decides whether you survive. Why capital allocation dominates entry precision in leveraged CFD markets, and how to build a sizing rule you can actually follow.
Where this read is probably wrong
Three things could sink it. Strategist targets are slow; a "cut" is often just marking to a move that already happened, and the S&P is only 1.9% off its high. My drawdown numbers use daily closes and calendar-year windows — real intraday drawdowns run deeper, and none of it forecasts 2026. A base rate is not a prediction, and 1950–2026 spans regimes that may not repeat.
The third one is the uncomfortable one: I may be over-reading the sequence. If the index simply grinds higher without ever pulling back 5% — which happened in a handful of those 77 years — then everyone who sized for a drawdown that never came paid financing for insurance they didn't need. VIX at 14.81 is the market saying exactly that, and the market has been right more often than strategists have.
What to actually do with three conflicting targets
- Treat the 500-point gap between 7,700 and 8,200 as your uncertainty budget. A position that only works if one specific number is right is too big.
- Size so a 10% drawdown is survivable by construction. If it isn't, the target is irrelevant to you.
- Read your broker's financing schedule before holding a levered index position for weeks. At a 5% benchmark this isn't a rounding error.
- Decide in advance whether a 10% drop is your add or your exit. Deciding at the low is how accounts end.
- Check the correlation. If one rate story drives your index long and your other positions too, you have a single bet wearing three costumes.
Method note: drawdown figures come from ^GSPC daily closes pulled from Yahoo Finance, 1950-01-03 through 2026-09-18 (19,300 sessions), measured peak-to-trough within each calendar year. Descriptive statistics, not a strategy and not a forecast. Price and volatility data are as of the Friday, Sept 18 close.
Charts and analysis on this site are for research only and are not investment advice.
More in News
 News2026-09-19
Bitcoin Reclaimed $80,000 on a Rule Nobody Has Read
The CFTC's crypto filing reached the White House with no published text and no deadline. Bitcoin still jumped 5.9% on Friday. Here's what the filing says, what it doesn't, and how to size around it.
 News2026-09-18
Buffett Gave Up the Chair on Friday. Berkshire's Stock Shrugged — and That's the Tradeable Part
Warren Buffett quit the Berkshire chair after 56 years. The stock opened 0.4% lower and went nowhere. What a non-event actually tells CFD traders about sizing, gap risk and the index exposure you didn't choose.
 News2026-09-17
The SEC Cleared a Path to 24/7 Stock Trading. Gap Risk Just Moved.
The SEC's five-year Innovation Exemption lets venues trade tokenized U.S. stocks. The headline is 24/7 trading — but the halt rule buried in the order is what leveraged traders should be reading.