The 10-Year Is at a 2007 High. The Carry Is the Trade.
Friday's close: a 2007 high nobody sold
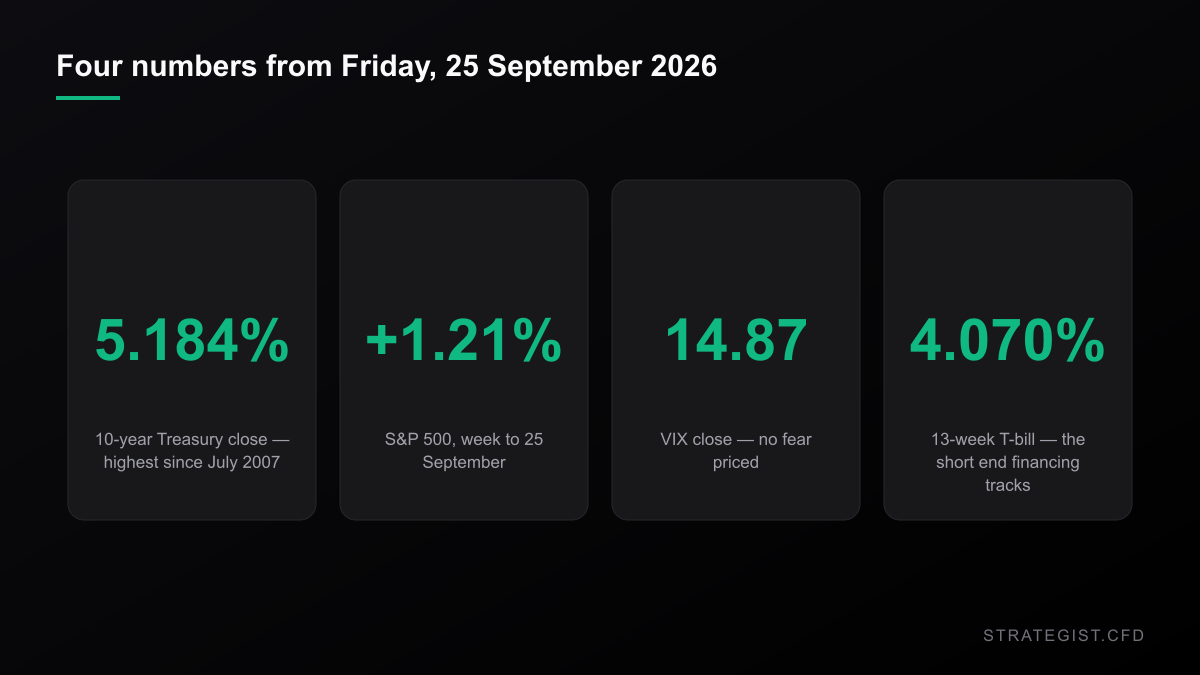
The 10-year Treasury yield closed at 5.184% on Friday 25 September 2026. The last time it was at or above that level was 6 July 2007 — nineteen years ago, before the financial crisis repriced everything.
In the same week the S&P 500 closed at 7,743.41, up 1.21%, and now sits 13.12% higher year to date. The VIX closed at 14.87.
Read those four numbers together and something odd appears. The cost of money is back where it was when the first iPhone shipped, and the equity market's answer has been to finish the week higher while pricing almost no volatility at all. That combination — a nineteen-year high in the discount rate and a VIX under 15 — is the actual story of the week, and it is worth separating into the part that is a forecast and the part that is arithmetic.
The week, day by day
Six sessions. Yields rose on five of them:
- Fri 18 Sep — 10-year +5.1bp, S&P +0.17%
- Mon 21 Sep — −3.5bp, S&P +1.49%
- Tue 22 Sep — +0.5bp, S&P −0.00%
- Wed 23 Sep — +14.6bp, S&P −0.75%
- Thu 24 Sep — +4.8bp, S&P −0.02%
- Fri 25 Sep — +2.2bp, S&P +0.51%
Only one session had a yield move worth the name: Wednesday's 14.6 basis points. It is also the only session where equities lost anything meaningful. Everything else is a market grinding higher in single-digit basis points while the index drifts up beside it. If you were watching the 10-year print a nineteen-year high and expecting the equity market to care, the tape says it did not — at least not in a way that shows up in the index.
That is not the same as saying nothing changed. It means the change is not in the level of the index. It is in the relationship between the two assets, and in what it now costs to hold a position.
What the stock-bond relationship actually did
This is where it gets more interesting than "yields up, stocks down". Take the S&P's daily return and the 10-year's daily change, and roll a 63-session correlation across them:
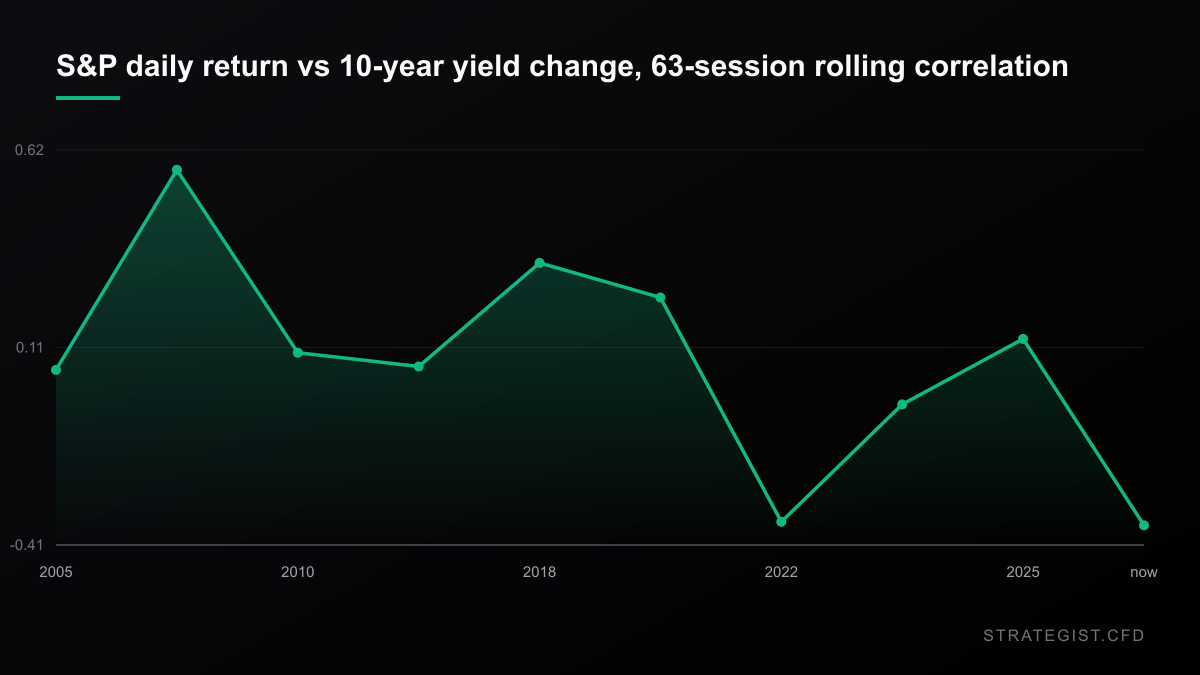
At the end of 2007 — the last time the yield sat where it sits now — that correlation was +0.62. Yields and stocks moved together. A strong economy lifted both, and the discount rate was not the thing setting prices. At the end of 2022 it was −0.40. Now it is −0.41. Over the past twelve months it has ranged from −0.69 to +0.26 and has been positive on only 31% of sessions.
Same yield level, opposite sign. In 2007 a 10-year at 5.18% was evidence of growth. In 2026 it is a discount rate applied to a market trading at a far higher multiple, and the relationship has flipped with it. This matters for anyone holding two positions at once: a hedge built in the 2007 regime does the opposite of what it did then.
The forward study: the sign flipped after 2020
A correlation describes what already happened. To ask what tends to come next, take every session since 1990 where the 10-year closed at a 252-day high — 253 of them in total — and measure what the S&P did afterwards:
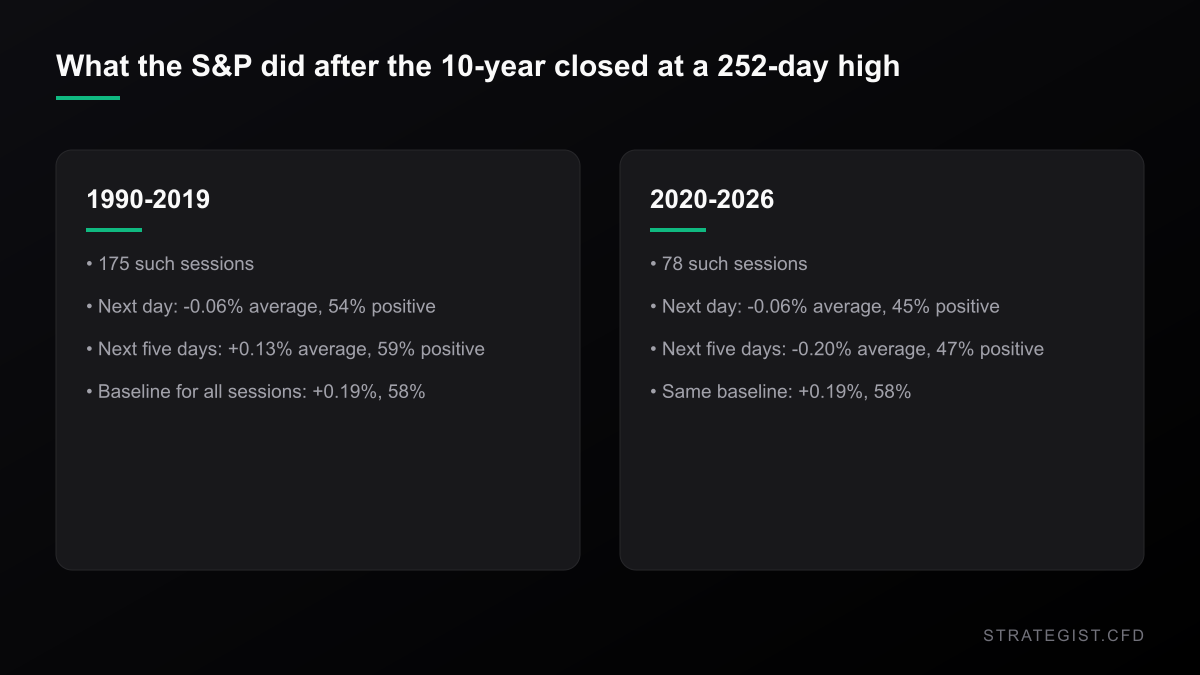
In 1990–2019 a fresh 252-day high in the 10-year was followed by an average five-day gain of +0.13%, positive 59% of the time. In 2020–2026 the same event is followed by −0.20%, positive 47% of the time. The baseline for every session since 1990 is +0.19% and 58%. So a yield high used to be a mild tailwind against a positive baseline, and is now a mild headwind against the same baseline.
Be careful with the size of that. The gap between the two eras is about 0.4 percentage points on a five-day horizon, and the recent bucket holds 78 observations. That is a tilt, not a signal — nobody should trade a 0.4% expected move after costs. What it does justify is a change in assumption: you can no longer count on the equity drift to pay for the cost of holding a position. Which brings us to the part of this that is not a forecast at all.
Where the cost actually sits
Everything above is a probability. The financing on a leveraged position is arithmetic, and it is the only number in a trade that is certain.
A long CFD position pays overnight financing: a benchmark rate plus the broker's markup. A short position receives the benchmark minus the markup. The benchmark tracks the short end of the curve, not the 10-year — that distinction matters, and it is why the 10-year headline is not literally your bill. The 13-week T-bill closed Friday at 4.070%, itself a year-to-date high. Add a 2% markup, apply leverage, and the annual cost as a share of your equity looks like this:
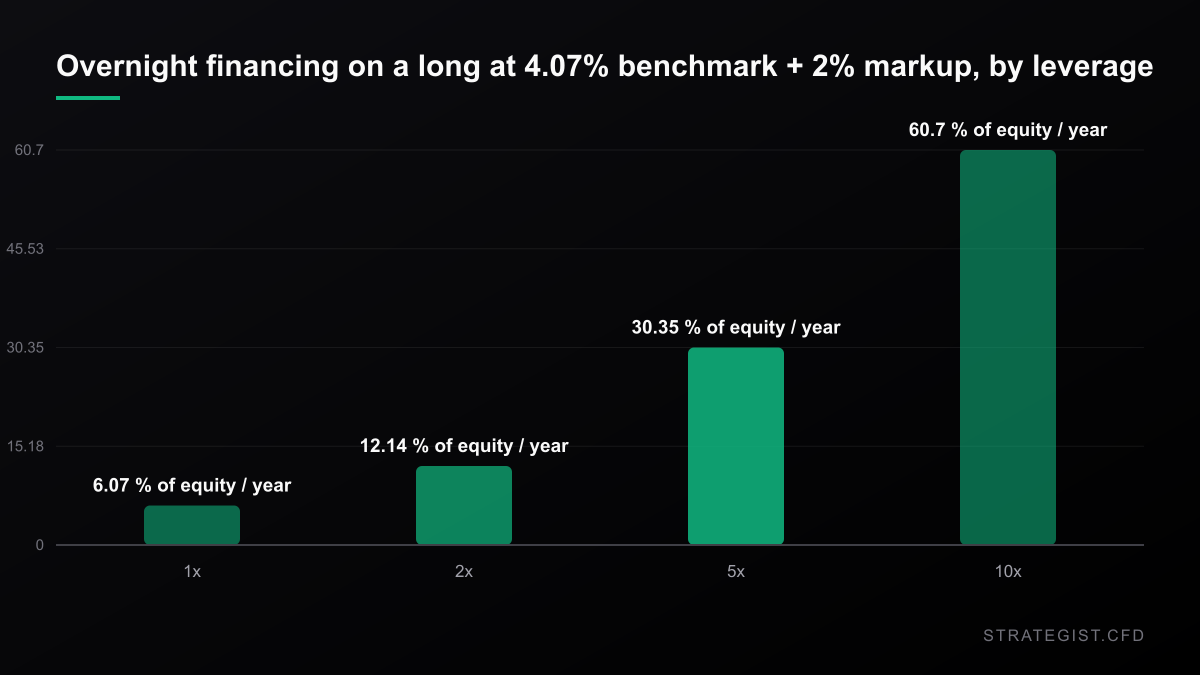
At 5x that is 30.4% of your equity per year, or 2.53% every month, before the market has done anything at all. At 10x it is 60.7%. Note the asymmetry in direction: the long pays, the short is paid, and both sides are charged the markup. A position held over a Wednesday close carries three days of swap for the weekend.
The arithmetic of waiting
Here is the same number applied to a real setup. Suppose a trade risks 1R, where 1R is 2% of the instrument's price, and wins at the 0.6R target the way our signal board does. The win is 1.2% of price. At 5x leverage that is 6.0% of your equity. Against a carry of 2.53% a month, two and a half months of holding consumes the entire target. You can be right about direction and still finish flat.
Now shrink 1R. On the signal board we publish, the median forex setup risks 0.365% of price, against 2.421% for the median index setup — a factor of 6.6. The same 0.6R win is 0.219% of price on the forex card, which is 1.10% of equity at 5x, and the carry consumes that in about thirteen days. The index version of the same win is 7.26% of equity and its runway is roughly twelve weeks. Same pattern, same target, same hit rate — and the forex trade has about a seventh of the time to be right.
None of that says which setup is better. It says the two setups do not cost the same to hold while they work out, and that the difference is large enough to change what you should be trading.
What to do with it
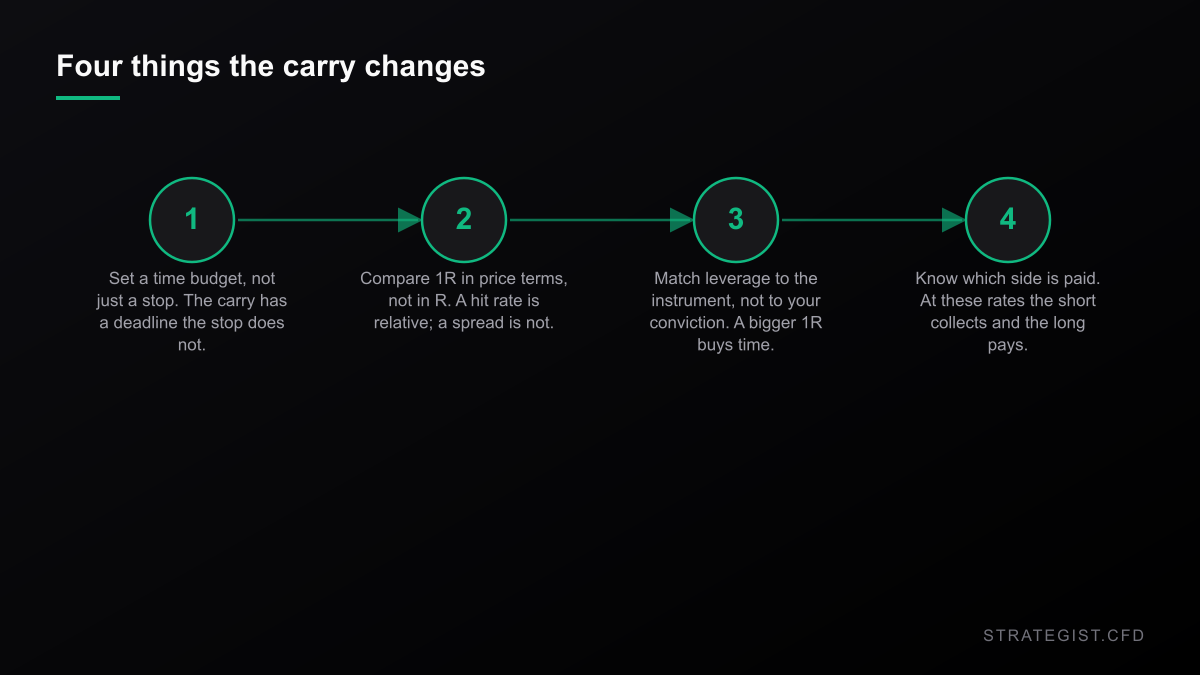
- Give every trade a time budget, not just a stop. The carry sets a deadline the stop does not. If the arithmetic says thirteen days, a setup that usually resolves in a month is not a trade at this leverage, however good the chart looks.
- Check 1R in price terms before you check the hit rate. A hit rate is relative and a spread is not. Two setups with the same 65% and the same 0.6R target can have wildly different carry-adjusted outcomes.
- Match leverage to the instrument, not to your conviction. The index card survives the carry because its 1R is 6.6 times larger, not because its signal is better.
- Remember which side gets paid. At these rates a short position collects financing. That is not a reason to be short — but it is a reason a short can afford to wait and a long cannot.
Put the numbers in before you size the position, not after:
Risk Analyzer
Quantify event-specific risks and calculate potential impact on your portfolio.
What I measured, and what it does not say
Every figure above is computed from Yahoo Finance daily bars: the 10-year (^TNX), the S&P 500 (^GSPC) and the 13-week T-bill (^IRX), from 1 January 1990 to 25 September 2026, with the curve taken from the 25 September close. The correlation is a 63-session rolling Pearson correlation of daily S&P returns against daily 10-year changes. The forward study counts sessions where the 10-year closed at a 252-day high and measures the S&P's subsequent one-day and five-day returns, against the baseline of every session in the same window. The signal-board figures are the median planned risk of the live cards published on 26 September 2026.
What it is not: a backtest, a strategy, or a live account. A correlation is descriptive and does not establish cause. The recent bucket in the forward study holds 78 observations and its effect is about 0.4 percentage points. The carry table is arithmetic on a stated benchmark and a stated markup — your broker's rate is its own number, and the point is the shape, not the digits. No commission, spread, slippage or dividend adjustment is modelled anywhere here. The hit rates referred to are measured from prices that could actually be paid, but they are still past prices.
If you want the other half of this — which formations survive their own costs, and how much of a signal board clears a realistic spread — that is the audit we ran on the board itself:
Why Position Sizing Matters More Than Entry Signals
Entry signals decide where you trade; position sizing decides whether you survive. Why capital allocation dominates entry precision in leveraged CFD markets, and how to build a sizing rule you can actually follow.
More in News
 News2026-09-21
European Gas Storage Is at 69%. The Price Just Fell 7% — and Both Are True
TTF broke below EUR80 on Monday while EU storage sat 16 points under its five-year average. An inverted curve pays utilities not to fill up, so the two facts aren't in conflict — they're the same fact.
 News2026-09-20
Wells Fargo Cut Its S&P 500 Target to 7,700. The Market Is at 7,650.
Three firms now publish three different year-end targets for the same index — 7,700, 7,900 and 8,200 — and all three sit above Friday's close. The disagreement isn't the signal; the path is.
 News2026-09-19
Bitcoin Reclaimed $80,000 on a Rule Nobody Has Read
The CFTC's crypto filing reached the White House with no published text and no deadline. Bitcoin still jumped 5.9% on Friday. Here's what the filing says, what it doesn't, and how to size around it.