
The Timeframe Is a Bigger Lever Than the Pattern
Two strategies, the same 68%
The pattern-analysis board scans 350 instruments across six timeframes and currently carries 1,073 live cards. Sort those cards by timeframe and the win rate barely moves: 68.1% on the hourly, 70.3% on the 15-minute. Screen on win rate alone and you would conclude that all six are the same product.
They are not. Sorted by the edge that actually reaches the account, the same board spans a factor of 7.8.
The metric that decides: expected gross margin
Win rate tells you how often. It tells you nothing about how much. Two inputs turn it into money:
- Average R — the average multiple of risk a setup has produced historically, scored under the board’s exit rule (first target 0.6R, half the position held to a 1.2R runner).
- Stop distance — the entry-to-stop gap as a percentage of price. This is the denominator that converts R into a return.
Multiply them and you get the expected gross margin: the average percentage of price a setup is worth, before any cost. That is the quantity a CFD account actually experiences.
Measured: the timeframe spreads it 7.8-fold
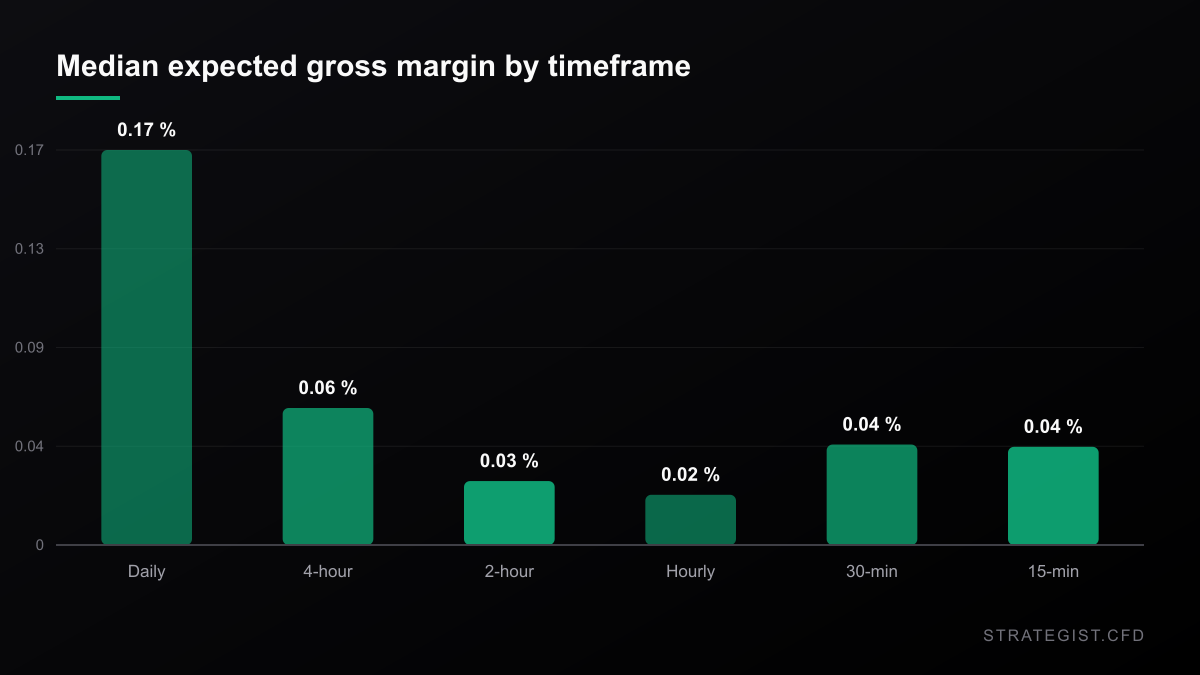
Across the 1,073 live cards:
| Timeframe | Cards | Median win rate | Median stop | Median expected margin |
|---|---|---|---|---|
| Daily | 194 | 69.6% | 1.07% of price | 0.173% |
| 4-hour | 160 | 69.1% | 0.48% of price | 0.060% |
| 2-hour | 177 | 68.7% | 0.28% of price | 0.028% |
| Hourly | 167 | 68.1% | 0.20% of price | 0.022% |
| 30-minute | 200 | 70.2% | 0.19% of price | 0.044% |
| 15-minute | 175 | 70.3% | 0.22% of price | 0.043% |
Read the win-rate column and nothing happens — a 2.2-point spread, well inside noise. Read the last column and the daily is worth 7.8 times the hourly, 0.173% of price against 0.022%.
Why the stop distance, not the win rate
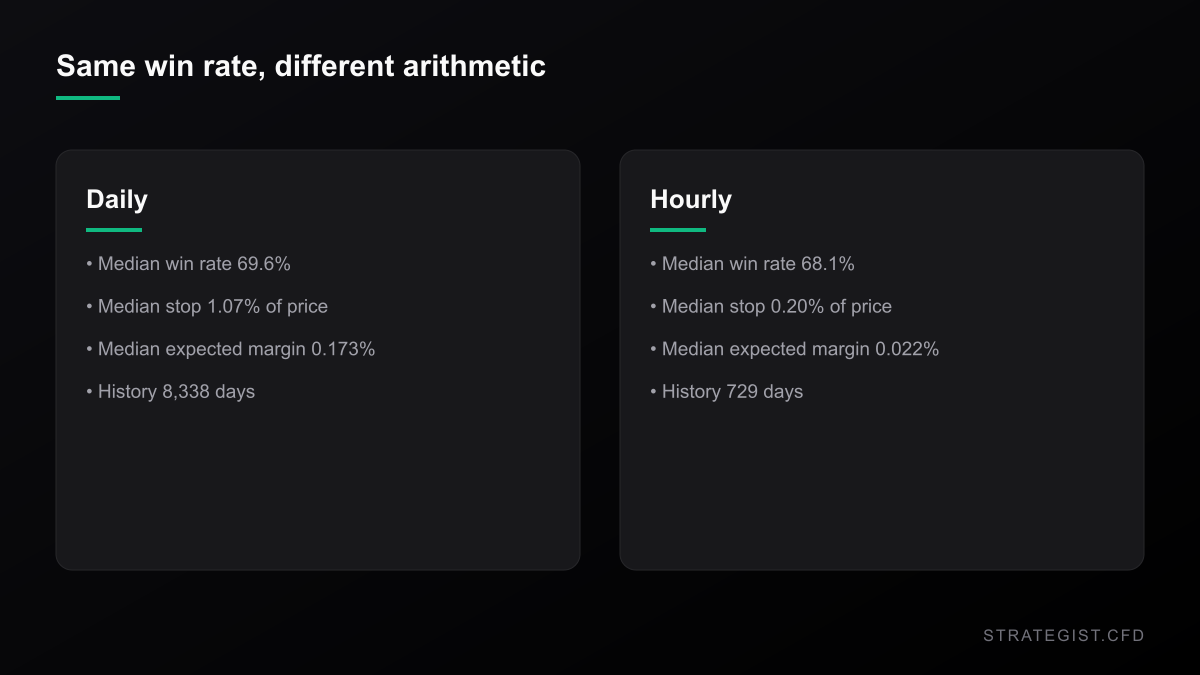
Average R is nearly flat across timeframes: 0.115 on the hourly against 0.155 on the daily, a 35% difference. The stop distance is not flat at all: 1.07% of price on the daily against 0.20% on the hourly, a factor of five. The product inherits the wider spread.
The mechanism is mechanical rather than mysterious. A daily bar covers more ground than an hourly bar, so the same structural stop — the swing low, the pattern’s invalidation level — sits further away once you express it as a percentage of price. Volatility scales with the bar length. Signal quality does not.
The history cap that shapes the sample
Two of the six timeframes are not native. The 4-hour and 2-hour series are built by merging hourly bars four and two at a time, which is why they carry 728 and 729 days of history. The 30-minute and 15-minute series are capped near 60 days by the data provider’s limit on intraday history.
That asymmetry decides which cells survive. Every card must clear a minimum sample before it is published — 30 observations on the daily, 20 on the 4-hour and 2-hour. Because the short timeframes cannot accumulate history, they lose far more cells to that gate: 5,113 suppressed on the 30-minute and 5,060 on the 15-minute, against 2,413 on the daily. The board is not showing you the best 30-minute setups; it is showing you the ones that had enough history to be measured at all.
What this means for a retail account
If the median hourly card is worth 0.022% of price before costs, then a round-trip spread of 0.02% to 0.05% on a currency pair consumes the entire trade — and overnight financing consumes more. The daily card’s 0.173% survives the same cost with room to spare. Same model, same signals, same win rate; opposite verdict.
The practical conclusion is that changing the timeframe is a bigger lever on tradability than changing the pattern. Before hunting for a better setup, check what the stop distance does to the arithmetic.
Caveats
These are descriptive statistics, not a backtest and not a strategy. Every figure is a median computed from the site’s own published signal data on 2026-09-29, in-sample, under one exit rule. The 7.8× is a ratio of medians across a board whose composition is rebuilt on every scan, so it will move. Cost figures are illustrative assumptions, not broker quotes. No live account and no funded track record is being claimed.
More in Systematic Trading
 Systematic Trading2026-02-12
How to Reduce Drawdowns Without Destroying Expectancy
Cutting drawdowns by tightening stops usually destroys the edge it was meant to protect. A ranked approach to drawdown control — sizing, volatility adjustment, diversification and robustness — that keeps expectancy intact.
 Systematic Trading2026-02-12
How to Evaluate Risk-Adjusted Returns for Your Trading System
Total profit says almost nothing about a trading system. How to evaluate risk-adjusted performance using Sharpe ratio, maximum drawdown, return-to-drawdown, expectancy and return volatility — plus the mistakes that make traders misread their own results.
 Systematic Trading2026-02-12
How to Design a CFD Trading Strategy Before Risking Real Money
A step-by-step framework for designing a CFD trading strategy before risking capital: market selection, entry and exit rules, position sizing, backtesting, execution costs, and forward validation.