US Core Inflation Hits 4-Year Low: Is the Fed Pivot Finally Here?
US Core Inflation Hits 4-Year Low: Is the Fed Pivot Finally Here?
US Core Inflation Hits 4-Year Low: Is the Fed Pivot Finally Here?
Following the release of the January US CPI data, market sentiment has shifted decidedly "dovish." We observed a simultaneous drop in Treasury yields, a surge in equity futures, and a significant increase in the implied probability of three rate cuts in 2026.
The core driver? Inflation momentum is officially decelerating. But for systematic traders, the real question remains: Is this enough to confirm a definitive policy pivot? Let’s break down the structural data through the lens of macro strategy.
1. The Surface Data: A Clear Cooling Trend
According to the Bureau of Labor Statistics (BLS):
Tools
Access our suite of professional trading tools and calculators.
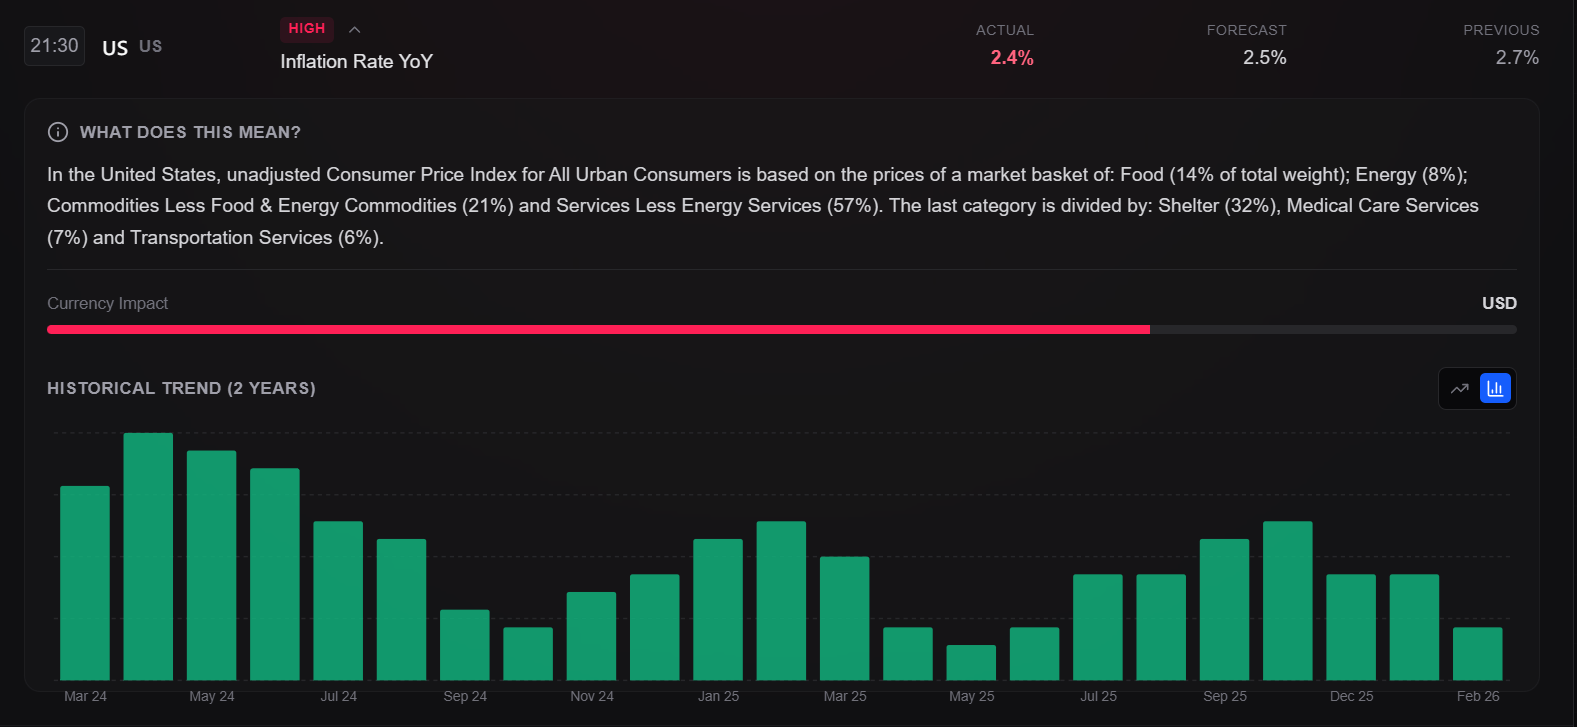
Headline CPI (MoM): +0.2% (Lower than the 0.3% consensus).
Headline CPI (YoY): 2.4% (A nearly 4-year low).
Core CPI (YoY): 2.5% (The lowest level since March 2021).
Key Takeaway: Prices are still rising, but the velocity of the increase is fading. The momentum that fueled the aggressive hiking cycle is dissipating.
2. Structural Analysis: The "Sticky" Service Sector
Despite the annual decline, the Core CPI (MoM) remained at 0.3%. A closer look reveals a divergence between goods and services:
Service Inflation (Excl. Energy): Grew 0.4% MoM, driven by airfares, healthcare, and education.
Goods Inflation: Remains weak, with used car prices and household goods continuing to trend downward.
For the Federal Reserve, this "sticky" service inflation is the final hurdle before committing to a full-scale pivot.
3. The Supercore Signal
Professional traders often ignore the noise and focus on "Supercore Inflation" (Services excluding shelter). While Jan saw a 0.6% MoM spike, the YoY trend remains at multi-year lows. Short-term volatility exists, but the long-term trajectory is undeniably downward.
4. Why the Market is Betting on 3 Rate Cuts
The market logic is straightforward:
Lower Inflation → Reduced Fed Tightening Pressure → Policy Easing Space.
With the current target range at 3.50%–3.75%, continued disinflation gives the Fed ample room to cut rates 2–3 times this year to prevent an over-tightening of the real economy.
Economic Calendar
Track high-impact global events with real-time updates and historical volatility analysis.
5. Macro Scenario Mapping
As a strategist, you must prepare for three potential paths:
Scenario | Inflation Outcome | Fed Action | Asset Impact |
Goldilocks | Hits 2% Target | 3 Cuts in 2026 | Bullish Equities/Gold; Bearish USD |
Stagflationary Lite | Ranges 2.4%-2.6% | Cuts Delayed | Neutral Equities; Bullish USD |
Rebound | Tariffs/Currency shock | No Cuts | Bearish Gold; Strong USD |
6. Trading Implications: Volatility is the Opportunity
The current "split signals" between a strong labor market and cooling inflation create a tug-of-war in policy.
Strong Jobs: No rush to cut.
Falling CPI: Space to cut.
This friction leads to increased volatility, which for systematic traders, represents the primary source of alpha. If the 3-cut consensus holds, we expect Gold to enter a structural bull cycle as real yields decline, while the USD may face long-term overhead resistance.
7. Strategist’s Conclusion: Focus on the Trend, Not the Print
Professional trading isn't about reacting to a single data point; it's about identifying the change in the underlying regime.
Inflation is cooling.
Service stickiness is the "X-factor."
The market always prices in the future before the Fed acts.
Understanding the Interest Rate Path is the master key to navigating the direction of the USD, Gold, and Global Equities.
Stay ahead of the markets with Strategist. Use our AI-driven tools to analyze macro trends and optimize your systematic trading performance.