Micron's Record Quarter Barely Moved the Stock. The Volatility Is the Story.
The quarter was, on paper, enormous
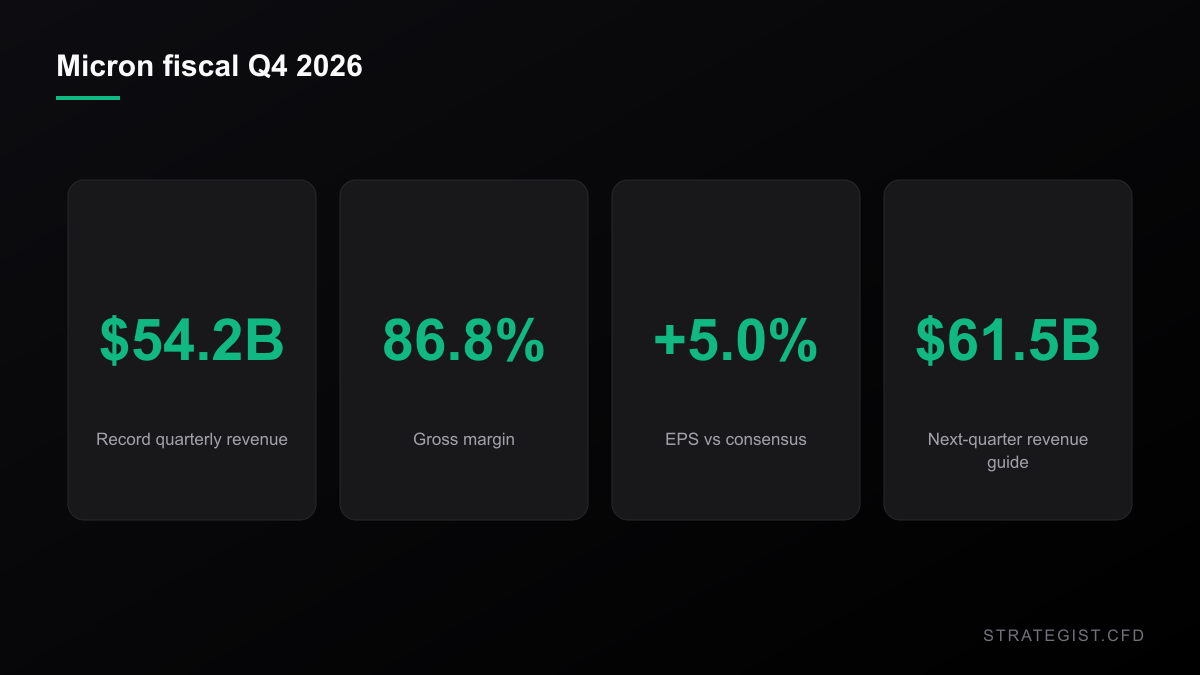
Micron reported fiscal Q4 after the close on 30 September, and by any measure it was the best quarter in the company's history. Revenue came in around $54.2 billion. Gross margin was about 86.8%. Net profit was up more than tenfold year on year. Data centre revenue jumped roughly eleven-fold and now accounts for something like two-thirds of the business. Guidance for the following quarter landed near $61.5 billion, above what the street had been carrying.
Almost none of that showed up in the share price. Micron closed Wednesday at $1,065.11. On Thursday it opened at $1,054.34, traded as low as $1,022.90 — about 4% below Wednesday's close — and was last around $1,063 mid-session, essentially flat. That session was still in progress when this was written, so treat the last figure as unfinished.
The reason doing the rounds was the capex side of the call: Micron raised its spending outlook, and investors who had spent a year paying up for the revenue line now have to pay for what it costs to produce it. That is the normal sequence in a capacity cycle. It is also the least interesting part of the story for anyone holding the stock.
The beat got smaller before the stock stopped moving
Here is the detail that didn't make the headlines. Micron's earnings surprise over its last four reports, taken from Yahoo's earnings table: +20.6%, +33.2%, +21.4%, and +5.0% for the quarter just printed. That last one is $33.42 of EPS against a $31.82 consensus — the smallest gap of the four by a wide margin.
That is not a claim about the business. Revenue grew, margins expanded, guidance beat. It is a claim about the distance between what the company delivered and what the market had already written down. When that distance closes, price stops reacting, however good the absolute numbers look.
The reaction did stop. Using report dates that Yahoo's own earnings calendar confirms, the session after each of Micron's last four reports moved +10.21%, -3.78%, +15.74%, and — for 1 October, still open — about -0.2% at mid-session. Four observations, not a law. But notice two things: the biggest surprise in the group, +33.2%, produced a down day, and the smallest, +5.0%, produced the quietest session. Direction was not a function of the beat.
Percent volatility round-tripped. Dollar volatility didn't.
This is where it stops being a news story and starts being a trading problem.
Micron closed 2025 at $285.41. It last traded around $1,063 on 1 October, up roughly 272% year to date, on top of 239% in 2025. The peak close was $1,213.56 on 25 June; the lowest close after that was $739.00 on 29 July — a 39.1% drawdown in about five weeks, in a company that had just reported the best quarter in its history.
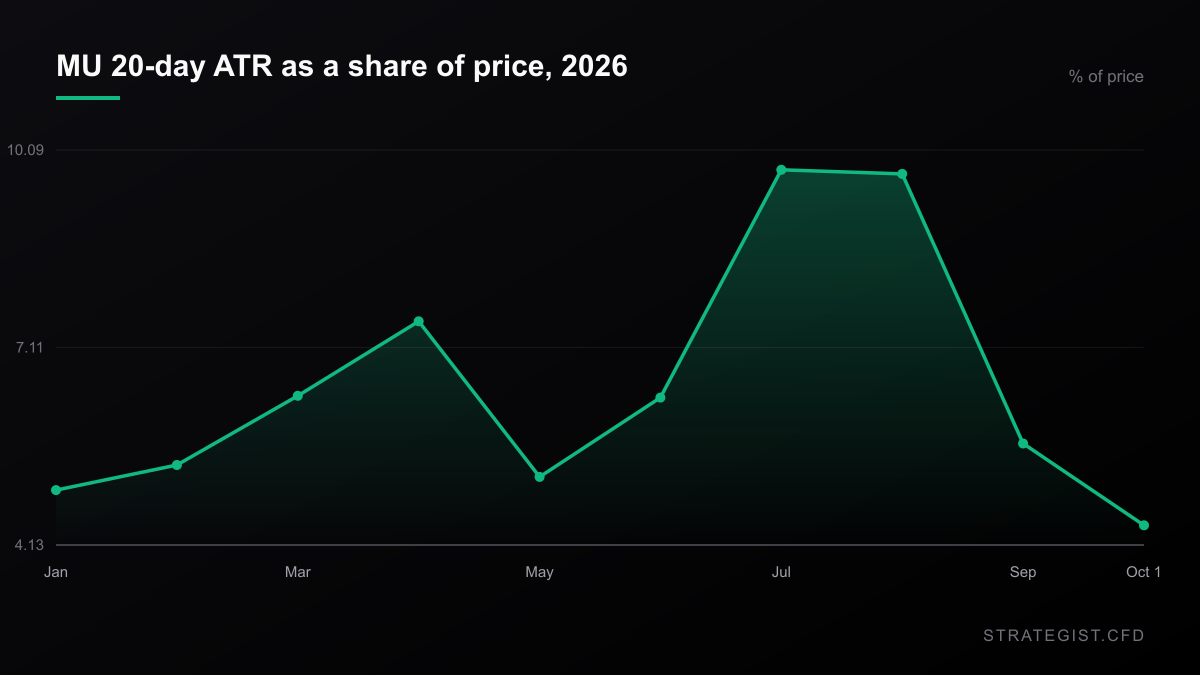
Micron's 20-day average true range as a share of price ran 4.72% in January, 6.30% in March, 10.09% in July, 10.02% in August, then 5.50% in September and about 4.13% now. In percentage terms, volatility is close to where the year started.
In dollars it is nowhere near. One share's 20-day ATR was $14.88 on 2 January, $104.13 at the start of July, and $43.96 now. The price tripled, and the dollar distance a single share covers in an average day went up 2.95 times. Over the last 252 sessions Micron's annualised volatility is 81.21% against SPY's 12.95% — 6.27 times. Your account is denominated in dollars, not in percent.
What one percent of risk actually buys
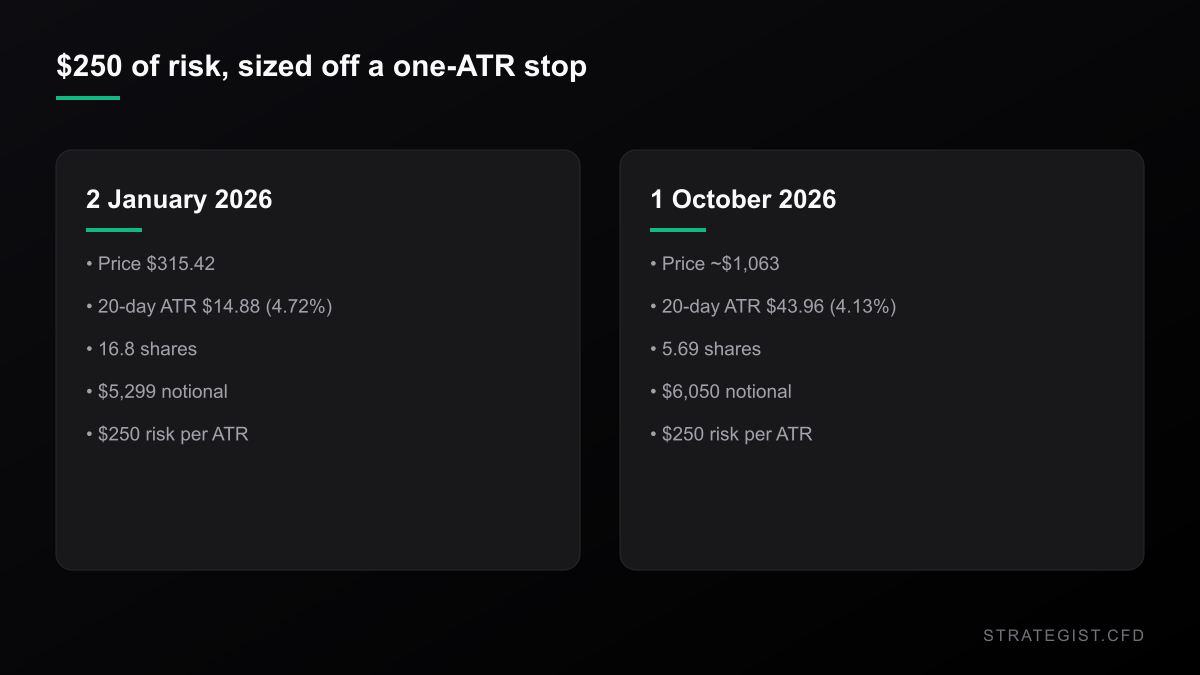
Take a $25,000 account and a 1% risk budget — $250 per trade.
On 2 January a one-ATR stop cost $14.88 per share, so $250 of risk bought 16.8 shares, about $5,299 of notional. On 1 October a one-ATR stop costs $43.96, so the same $250 buys 5.69 shares, about $6,050 of notional. Roughly the same dollars of exposure, because percentage volatility is roughly the same. If you size off risk, the share price itself is irrelevant.
It stops being irrelevant the moment you size off anything else. Buy 16.8 shares in January and never touch the position, and those same 16.8 shares now carry about $738 of risk per average day — 2.95 times the budget you set, with no decision ever made. Hold that count into July, when one share moved $104 a day, and it was carrying $1,749.
Widen the stop to two ATRs, which is the honest way to sit through a swing in this name, and $250 of risk in Micron buys 2.84 shares — roughly $3,020 of notional, or 0.12x leverage on a $25k account. The identical calculation on SPY, whose 20-day ATR is 0.89% of price, buys about $14,100 of notional, or 0.56x. Same risk budget, about 4.7 times the exposure. That gap is the whole argument for caring about volatility rather than direction. Run your own numbers through the
Risk Analyzer
Quantify event-specific risks and calculate potential impact on your portfolio.
Why Position Sizing Matters More Than Entry Signals
Entry signals decide where you trade; position sizing decides whether you survive. Why capital allocation dominates entry precision in leveraged CFD markets, and how to build a sizing rule you can actually follow.
Micron is not Nvidia, and that cuts both ways
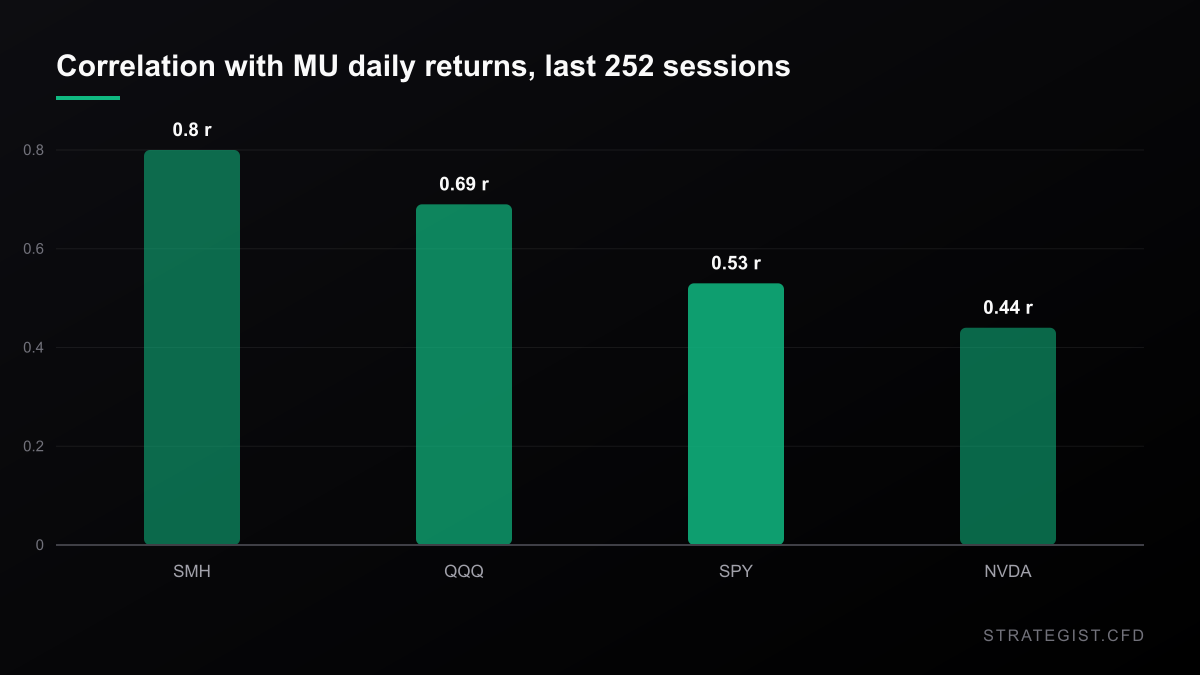
Most people file every AI-chip name under a single heading. Over the last 252 sessions, measured on daily closes, the correlation between Micron and the semiconductor ETF SMH is 0.80, and the two move in the same direction on 78.2% of days. Against QQQ it is 0.69; against SPY, 0.53. Against Nvidia it is 0.44, with the pair agreeing on only 63.5% of days.
So if you already hold a semiconductor basket, adding Micron is very close to buying the same trade twice. If you hold Nvidia, Micron is a good deal less redundant than the narrative implies — on roughly a third of days the two disagree. On 1 October, with Micron lower on the day, Nvidia was last about 1.0% higher and SMH about 0.6% higher, both intraday. The sympathy trade is a story told after the fact. Check what you already own against what you are about to add:
Correlation Matrix
Analyze the statistical relationship between different assets to avoid over-exposure.
Where this is wrong
- Regime. 31.6% of Micron's 2026 sessions have been 5% days or larger, against a 2019-2024 range of roughly 4% to 12%. If the memory cycle cools, the volatility inputs above shrink and every size here becomes too conservative. That is the safe direction to be wrong, but it will make the position feel pointless.
- ATR is a middle-of-the-distribution tool. Micron has had 23 sessions this year with a move of 8% or more. A one-ATR stop is an average case, not a worst case, and averages are what break first.
- The surprise series is four quarters long, and the consensus it is measured against moves. A shrinking beat may mean estimates caught up rather than that anything slowed down.
- One stock, one direction. Micron has had five drawdowns of 30% or more since 2018, including -57.8% between June 2024 and September 2025. A record quarter does not change the fact that this is a cyclical business.
What to actually do with it
- Re-run the size on anything you've held since January. Same share count, 2.95 times the risk.
- Size off ATR in dollars, not off a percentage you remember from a calmer month. July to October moved that number from $104.13 per share to $43.96.
- Decide before the next report whether you're holding through it. The last four report sessions had a median absolute move near 7%, against a median session of 1.69% since 2010. You cannot decide at 9:31 in a name that gapped +17.6% the morning after June's print.
- Check what else you own. If it's a semiconductor ETF, Micron adds concentration, not diversification.
- Accept that 0.12x leverage is the honest size here. If that feels too small to bother with, the right response is to trade something calmer, not to widen the stop.
Method note: every price figure here comes from daily OHLCV for MU, SPY, QQQ, NVDA and SMH pulled through Yahoo Finance, 2018-01-01 to 2026-10-01, with returns measured close-to-close and ATR as a 20-day mean true range. The 2026-10-01 bar was still forming. EPS surprises are Yahoo's consensus comparisons for the four most recent quarters; revenue, margin and guidance figures are as reported by Reuters, CNBC, Quiver and TradingKey. No strategy was backtested for this article — these are descriptive statistics and arithmetic, not a tested edge.
Charts and analysis on this site are for research only and are not investment advice
More in News
 News2026-09-30
Nasdaq Up 3%, Dow Down 3.5%: What a Split Month Does to Your Stop
Core PCE printed 3.0% against 3.3% expected, and the tape answered unevenly: Nasdaq 100 up, Dow down. September's gap between the two sits in the top 7% of months since 1992, and it changes the stop distance you should be using.
 News2026-09-29
Silver Is 47% Below Its January Peak. The Leverage Is an Illusion.
Silver fell 4.7% on Monday while gold fell 3.5%. I ran 6,539 sessions of COMEX data to see whether silver really is leveraged gold. It is 2.28x as volatile, but it only delivers about 1.35x on the days gold actually moves.
 News2026-09-29
Henry Hub vs TTF: The Same Molecule Priced Twice
US gas at $2.90/MMBtu against European gas at EUR 78/MWh is a factor of nine. Measured across 1,982 sessions, the spread has a median of 3.4x, a daily-return correlation of 0.13, and more volatility than either leg.