Silver Is 47% Below Its January Peak. The Leverage Is an Illusion.
Silver futures closed Monday at $61.22, down 4.71% from Friday's $64.25. Gold closed the same session at $4,168.40, down 3.54%. By Tuesday mid-session both had gone quiet again: silver around $61.24, gold near $4,181.
That pairing is why Heraeus, quoted by Kitco on Monday, described $60 as a key test for silver while noting China is on pace to import 1,700 tonnes of gold this year. It is also why every retail forum has someone repeating the same line: silver is gold with leverage attached, so if you like gold, buy silver.
Here is the part that gets skipped. Silver's record close was $115.08 on 26 January. It is now 46.8% below that. Gold, from its $5,318.40 record close on 29 January, is down 21.4%. Roughly double the drawdown, which is exactly what a leveraged version of gold is supposed to give you. The trouble lives in the days in between.
Monday, in numbers
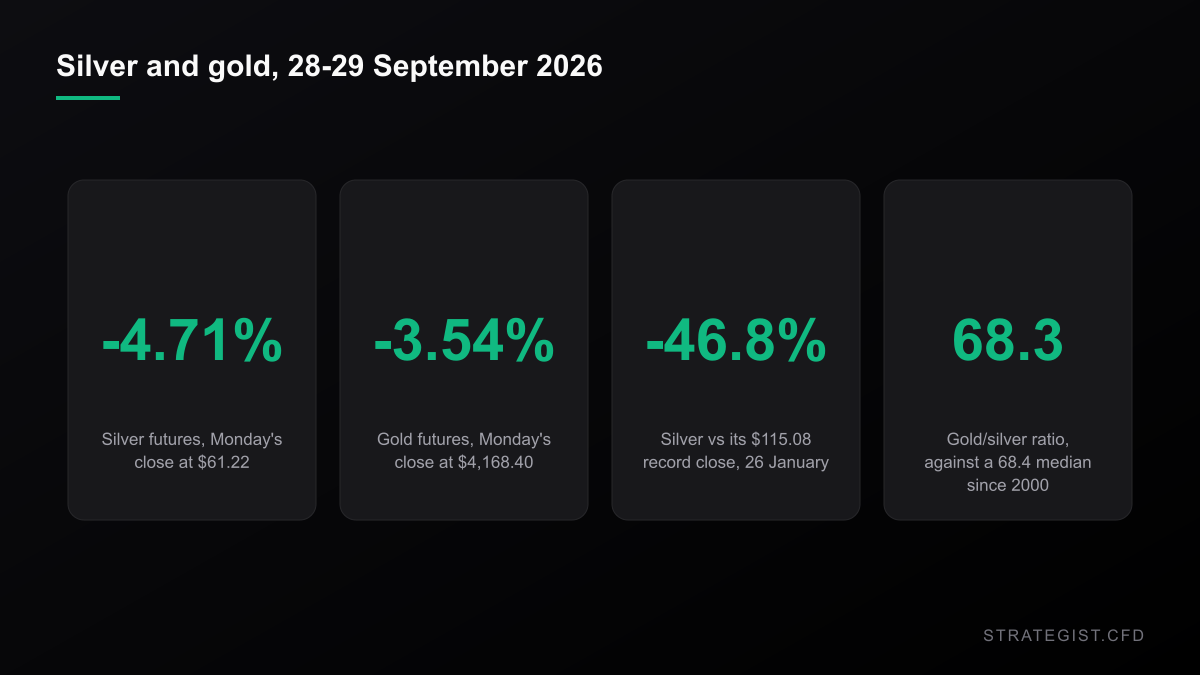
One session tells you very little, so treat this as the entry point rather than the evidence. Monday's move was genuinely large for both metals: silver's 4.71% fall ranks in the worst 19% of its 2026 sessions, and gold's 3.54% fall is its third-worst of the year. They moved together, which they do about 83% of the time in 2026.
The more useful number is where silver now sits. $61.22 against a January peak of $115.08 is a 46.8% drawdown on closing prices, and it is not the deepest one on record for this metal. That distinction matters more than Monday does.
The ratio already did the work
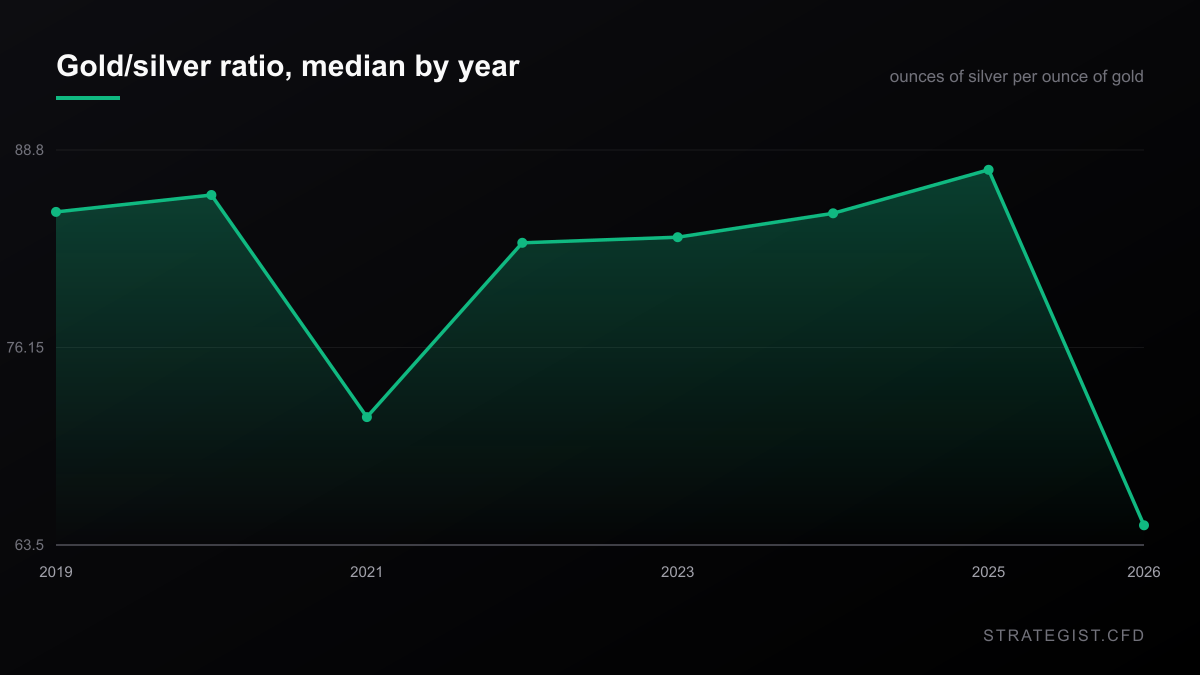
The gold/silver ratio closed Tuesday at 68.3. The median across the whole series since August 2000 is 68.4. On this measure silver is at the single most ordinary valuation of the last 26 years — not cheap, not expensive, just average.
It was not average a year ago. The ratio's median through 2025 was 88.8; through 2026 it has been 63.5. Silver did its catch-up in one violent year — 2025 was +142.3% for silver against +64.4% for gold — and then handed a large part of it back. If your thesis was that the ratio was too high and silver was cheap, the ratio is no longer saying that.
The Gold Rule of Thumb Says $4,000. The Market Says $4,321.
Kitco's rule of thumb says a 5.18% ten-year yield should have gold well below $4,000. I ran that number against 26 years of daily bars. The slope was never stable — and gold's beta to the S&P is now +0.65, which is why the hedge stopped hedging.
There is a counter-reading and it is a real one. The ratio's median sat at 80 or above every single year from 2017 through 2025. If that is still the regime, 68 is cheap and silver has room. If the 2000 to 2011 regime is the right comparison, where the median ran between 51 and 74, it is not. When you pick one, you are not measuring silver. You are picking a decade.
A 4% day is an ordinary Tuesday for silver
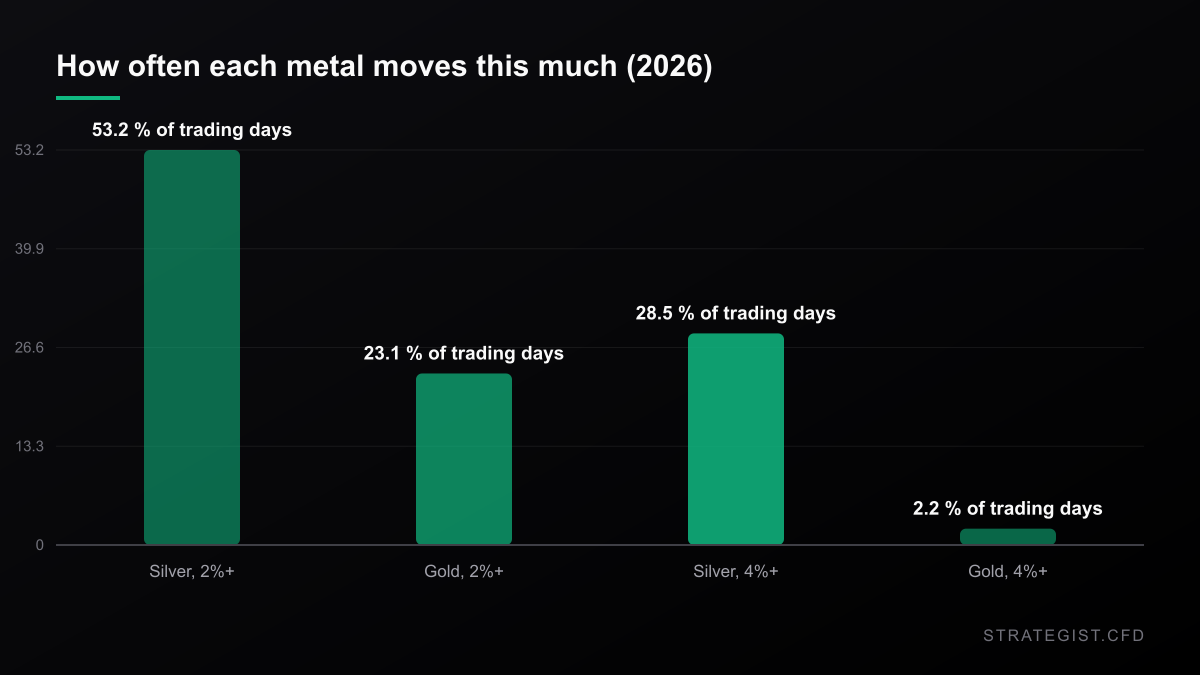
Measured on daily closes for 2026, silver's standard deviation is 4.34% against gold's 1.90%. That 2.28x ratio is what people mean when they call silver high-beta gold, and it is real.
Look at how it shows up in the calendar. Of the 186 sessions so far this year, silver has moved 2% or more on 99 of them, or 53.2%. Gold managed 43, or 23.1%. Widen it to 4% and the split turns brutal: silver 53 days (28.5%), gold 4 days (2.2%). More than one session in four, silver covers more ground in a day than most equity indices cover in a month.
For anyone sizing a CFD off a percentage stop, that single line is the whole trade. A stop distance that is sensible on gold is a rounding error on silver.
The leverage you get is not the volatility you pay for
I ran the numbers on 6,539 aligned sessions of COMEX silver and gold futures, from August 2000 to now. On days when gold fell, silver's median move was 1.35 times gold's. The 25th percentile of that ratio was 0.66, meaning on a quarter of those days silver moved less than gold did, or went the other way entirely. Only 20.5% of gold-down days produced amplification above 2.28x — the volatility multiple you are being charged for every day.
Two sessions this year make the point without any statistics at all. On 23 March gold fell 3.66% and silver fell 0.45%. On 10 June gold fell 3.57% and silver fell 0.76%. Anyone holding silver as a leveraged gold position watched the leverage simply not fire on a day they needed it.
The beta is also asymmetric, which is the piece nobody prices in. Regressing silver's daily percentage move on gold's: the slope is 1.308 on gold-up days and 1.555 on gold-down days. Silver takes more of the downside than the upside. Over a long enough holding period that is a slow leak, not a feature.
Correlation Matrix
Analyze the statistical relationship between different assets to avoid over-exposure.
Risk-matched, silver pays you less
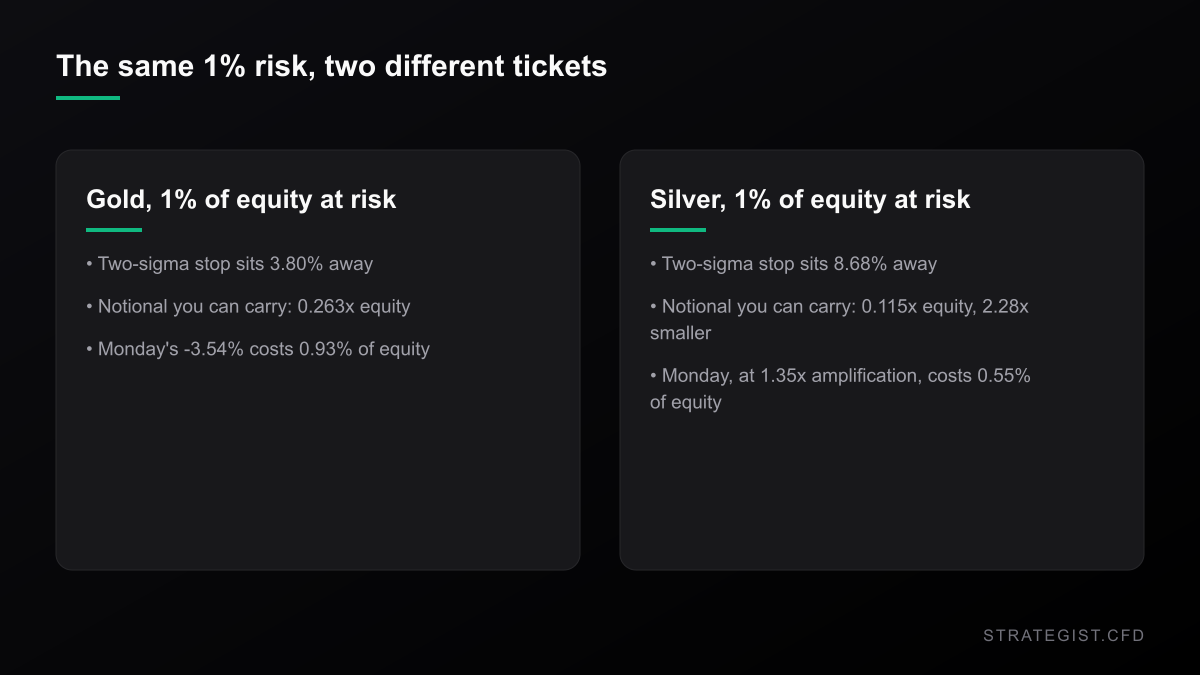
This is the arithmetic that actually decides the trade.
Take a 1% equity risk budget and set the stop at two standard deviations of the 2026 daily distribution. For gold that is 3.80% of price, so you can carry 0.263x your equity in notional. For silver it is 8.68%, so you can carry 0.115x. Identical risk, 2.28x less notional.
Now push Monday through both. Gold lost 3.54%, so the gold position loses 0.93% of equity. The silver position, at that 1.35x median amplification, loses 0.55%. Risk-matched silver delivered 0.59x the P&L of risk-matched gold — on a session where silver's headline move was the bigger one by a third.
Risk Analyzer
Quantify event-specific risks and calculate potential impact on your portfolio.
That is what leverage costs when it arrives as volatility rather than as direction. You halve your size to hold the risk constant, and you do not get the move back. Silver is not a smaller ticket to the same trade; it is a noisier instrument with a correlated driver.
The recovery time is the real position size
Silver has had four drawdowns of 25% or worse since 2000 on closing prices. The shallowest, a 32.8% slide in 2004, took 409 trading days to recover. The 2008 one, down 57.5%, took 639. The one that began in April 2011 fell 75.8% and did not see its old close again until 8 October 2025 — 3,631 trading days, roughly 14.4 years.
Now put financing on top. The 13-week bill is around 4.09%; add a 2% broker markup and a 1x long position costs roughly 6.09% of notional per year. Held flat across 3,631 sessions at 1x, simple interest, that is about 88% of notional in carry, on top of a 76% drawdown. At 2x it is about 176%. A leveraged silver ETF shows the same mechanics in fast-forward: AGQ, the 2x daily silver fund, is down 56.2% year to date and 80.7% since 26 January, against silver's own -12.7% and -46.8%.
This is where CFD traders get hurt, because none of it is visible on the chart. The stop is on the chart. The carry is on the statement.
Where I could be wrong
Three ways, at least.
- The 2026 volatility figure is inflated by one session. Silver fell 31.35% on 30 January, and removing it would narrow the distribution and shrink the 8.68% stop with it. The direction of the result probably survives; the magnitude is softer than I have written it.
- The ratio is only a yardstick if you believe the yardstick. Around half of silver demand is industrial — solar, electronics, and a supply deficit that has run for several years. None of that appears in a ratio against gold, and any of it can re-rate silver on its own.
- None of this is a backtest. It is descriptive statistics plus a conditional-mean event study on daily futures closes. I did not run a strategy, I did not model spreads, slippage or contract roll, and the two-standard-deviation stop is a convention rather than an optimised parameter.
And the forward test says nothing useful. Of the 243 sessions since 2000 where gold fell 2% or more, silver's average next-day move was +0.15% against a +0.06% unconditional baseline, and its five-day move was +0.34% against +0.30%. That is noise. A big down day in gold tells you nothing about what silver does next, and reading a bounce into it is how people add to a loser.
What to actually do with this
- Size off silver's own volatility, never off gold's. If 1% is a working stop distance on XAU/USD, XAG/USD needs roughly 2.3x that for the same chance of being tagged.
- Stop treating silver as a directional proxy for gold. It is a different instrument with a correlated driver and its own supply story. If you want gold exposure, trade gold.
- Check the amplification before assuming it. On the days you actually care about, the median pay-off is 1.35x, not the 2.28x the volatility implies.
- Put carry in the plan before entry, not after. Silver's worst drawdowns are measured in years, and financing is billed in years.
- If you hold the cheap-silver thesis, say which decade you are comparing against. The 26-year median says average. The 2017 to 2025 median says cheap. Both readings come from the same number.
Method note: prices are COMEX continuous futures (SI=F, GC=F) daily closes from Yahoo Finance, 6,539 aligned sessions from 31 August 2000 to 29 September 2026; the 2026 sample is 186 sessions and the final bar is mid-session. Statistics are averages and conditional means, not a trading strategy.
Charts and analysis on this site are for research only and are not investment advice.
More in News
 News2026-09-29
Henry Hub vs TTF: The Same Molecule Priced Twice
US gas at $2.90/MMBtu against European gas at EUR 78/MWh is a factor of nine. Measured across 1,982 sessions, the spread has a median of 3.4x, a daily-return correlation of 0.13, and more volatility than either leg.
 News2026-09-26
Copper Set a Record High While 696,000 Tonnes Sat in New Orleans
Three-month copper came within $92 of its record while Shanghai cathode stocks fell to a three-year low and Comex warehouses held 69% of all exchange metal. The tightness is real — it is just not where the chart is. And the breakout trade that paid from 2000 to 2019 has not paid since 2020.
 News2026-09-26
The 10-Year Is at a 2007 High. The Carry Is the Trade.
The 10-year Treasury closed at 5.184%, the highest since July 2007 — and the S&P still finished the week up 1.21% with the VIX under 15. The stock-bond correlation has flipped sign since 2007, and the part of that which is not a forecast is the carry: it eats a forex setup's 0.6R target in about thirteen days.