Henry Hub vs TTF: The Same Molecule Priced Twice
The two prices, side by side
An explainer published by EBC Financial Group on 18 September 2026 put US natural gas at $2.90 per million British thermal units and European gas at €78 per megawatt hour, under the headline “why U.S. and European Natural Gas Prices Are So Different”. Both numbers describe the same molecule. The tape around that date agrees with both: the front-month Henry Hub contract closed at $2.90 on 17 September, and TTF traded between €76 and €78/MWh that week.
The unit mismatch is the first thing to fix. One megawatt hour is 3.412 MMBtu, so €78/MWh is €22.86/MMBtu; at EURUSD 1.137 that is roughly $26 per MMBtu against $2.90 — a factor of nine.
By the last aligned session in this study the gap had narrowed a little: Henry Hub $3.30, TTF €75.11/MWh, a ratio of 7.6×. The shape of the story did not change.
Everything below is measured from the Yahoo Finance continuous futures series for NG=F and TTF=F, converted at 3.412 MMBtu per MWh and the daily EURUSD rate. Descriptive statistics, not a backtest and not a strategy.
What the ratio has actually done
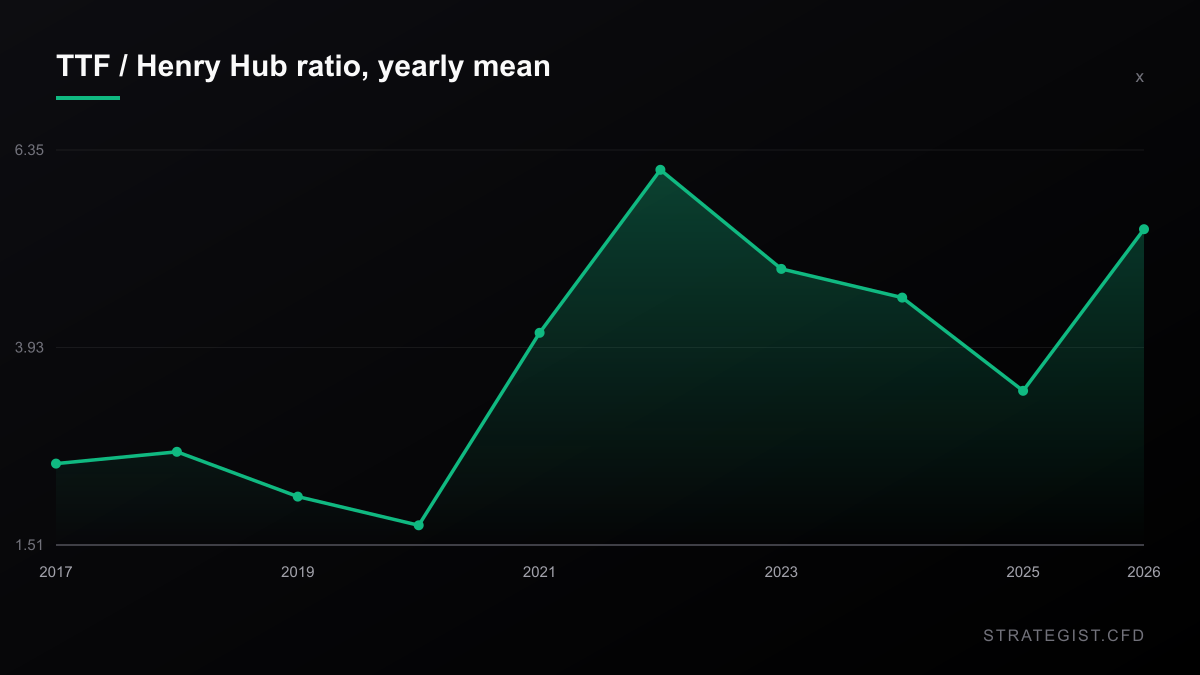
Aligning the two series on common sessions gives 1,982 observations, from 23 October 2017 to 24 September 2026. Over that window the TTF-to-Henry-Hub ratio has a median of 3.40×, an interquartile range of 2.22× to 4.97×, and a full range of 0.62× to 15.40×.
Today’s 7.6× sits in the top decile: the ratio has been at or above 7× on 7.0% of sessions and at or above 7.5× on 4.7%. The current spread is elevated — but not unprecedented, and nowhere near the 2022 extreme.
The yearly means tell the regime story: 2.35× in 2017, down to 1.51× in 2020, up to 6.35× in 2022, back to 3.34× in 2025, and 5.54× so far in 2026.
One detail is easy to miss and hard to explain away: on 34 sessions the spread was negative — US gas more expensive than European gas. An arbitrage that inverts 1.7% of the time is not an arbitrage in the sense that a futures calendar spread is.
For the storage side of the same story, see the earlier piece on European storage levels:
European Gas Storage Is at 69%. The Price Just Fell 7% — and Both Are True
TTF broke below EUR80 on Monday while EU storage sat 16 points under its five-year average. An inverted curve pays utilities not to fill up, so the two facts aren't in conflict — they're the same fact.
A spread that is not a hedge
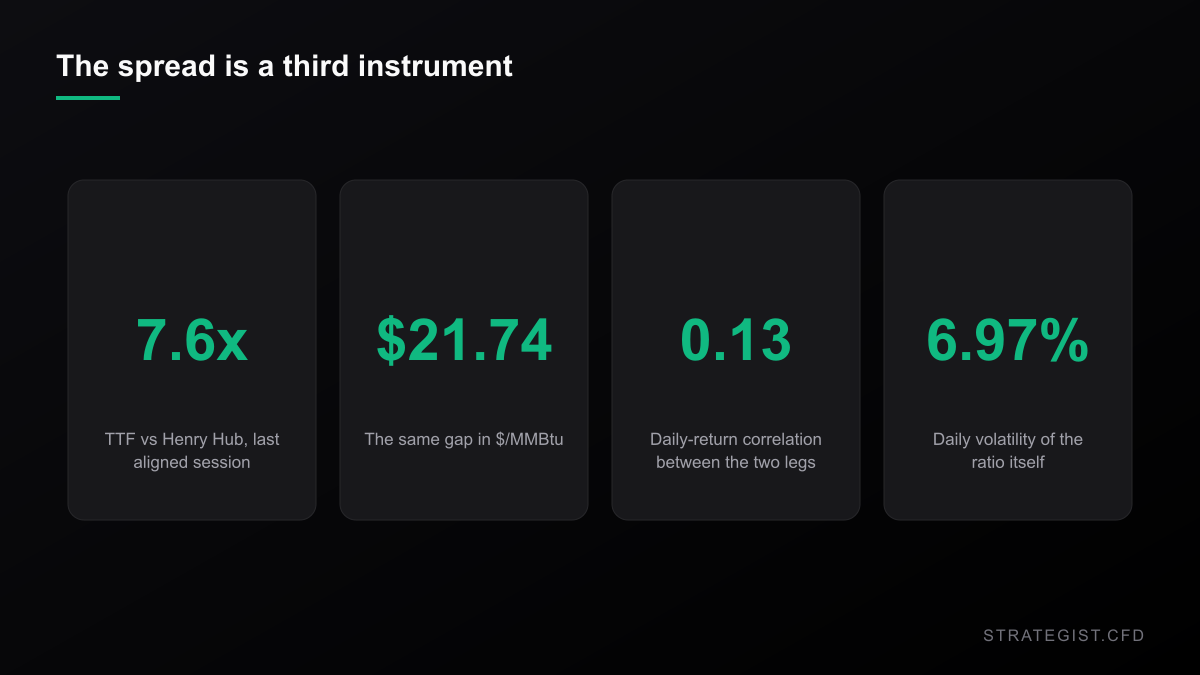
Here is the measurement that should change how the trade is framed. The correlation between the two legs’ daily returns is 0.13.
Their individual daily volatilities are 4.82% for Henry Hub and 5.43% for TTF. The ratio’s own daily volatility is 6.97% — higher than either leg.
That is not a paradox; it is arithmetic. Combining two series that are nearly uncorrelated does not cancel risk, it adds it. A trader who describes a long-TTF, short-Henry-Hub position as “hedged” is running a position with more day-to-day variance than either naked leg.
The currency leg contributes essentially nothing: the correlation between EURUSD daily returns and the ratio is −0.012. At daily frequency the spread is a gas story, not an FX story.
Why the levels regression lies
Regress TTF in dollars per MMBtu on Henry Hub in dollars per MMBtu, in levels, and the result looks convincing: slope 6.92, intercept −9.21, r 0.818, r² 0.669, over 1,982 observations. Read literally, every $1 on Henry Hub is worth $6.92 on TTF.
Do not read it literally. A levels regression on two trending series is dominated by where each series sat in each regime. Both were at multi-year highs in 2021 and 2022 and both came down afterwards; that co-movement alone will produce a high r² whether or not one price transmits into the other on any given day. The daily-return correlation of 0.13 is the honest version of the same question, and it says the day-to-day link is weak.
The practical consequence: sizing a hedge off r² = 0.67 would leave you with a position whose daily driver is close to independent of the thing you thought you had hedged.
The physical arbitrage, and why it cannot be arbitraged
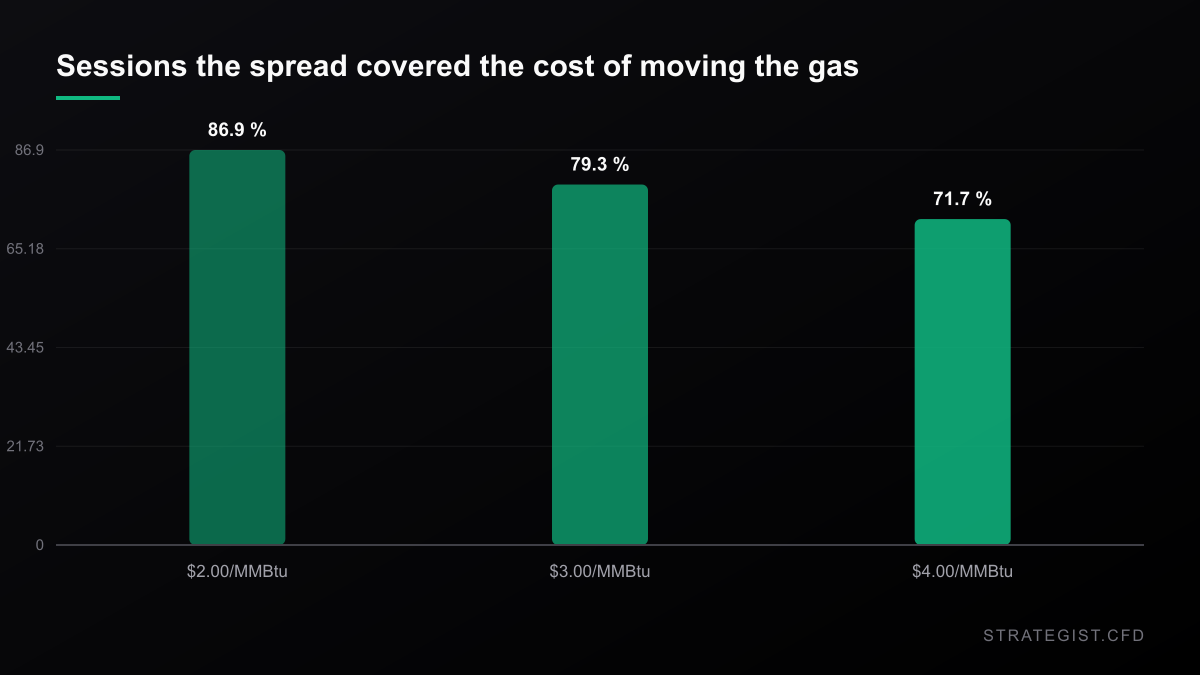
Moving the molecule across the Atlantic costs money: liquefaction, shipping and regasification are commonly put at $2 to $4 per MMBtu. Compare the observed spread against that bill and the picture is stark: the spread covered a $2 cost on 86.9% of sessions, a $3 cost on 79.3%, and a $4 cost on 71.7%.
Put differently, if the spread were nothing but the $3 shipping cost, the ratio would sit near 2.04×, with a range of 1.31× to 3.02×. The observed median is 3.40× — about 1.66× wider than the cost of moving the gas.
So why has it persisted for most of nine years? Because closing it does not require capital, it requires liquefaction capacity. US export terminals run close to their nameplate limit, so the marginal molecule has nowhere to go. The spread is a queue, not a mispricing, and a queue does not clear because a trader is willing to bet against it.
The 34 inverted sessions make the same point from the other side. Whatever the spread is, it is not held in place by arbitrage capital.
Where the spread actually breaks
The one stable relationship in the data is negative: the correlation between Henry Hub daily returns and the ratio’s daily change is −0.610. When US gas falls, the ratio widens, because Europe does not follow it down.
An event study on the largest such days — the 92 sessions where Henry Hub fell 7% or more, out of 1,981 — shows what follows:
- Next session: TTF mean −0.29%, median +0.70%. The mean and the median disagree in sign, so at one day out this is noise. The unconditional baseline is +0.23% mean.
- Ten sessions out: TTF mean +1.35%, median +1.46%; the ratio is up a mean +3.31%. The baseline ten-session drift is +0.12%.
Read honestly, that is a tendency, not a signal: 92 observations, a first-day distribution symmetric around zero, and a drift that only shows up over two weeks. Dropping the threshold to 4% moves the result around and sometimes reverses its sign, which tells you the effect is specific to large dislocations rather than a general rule about gas falling.
What a retail CFD account can actually do
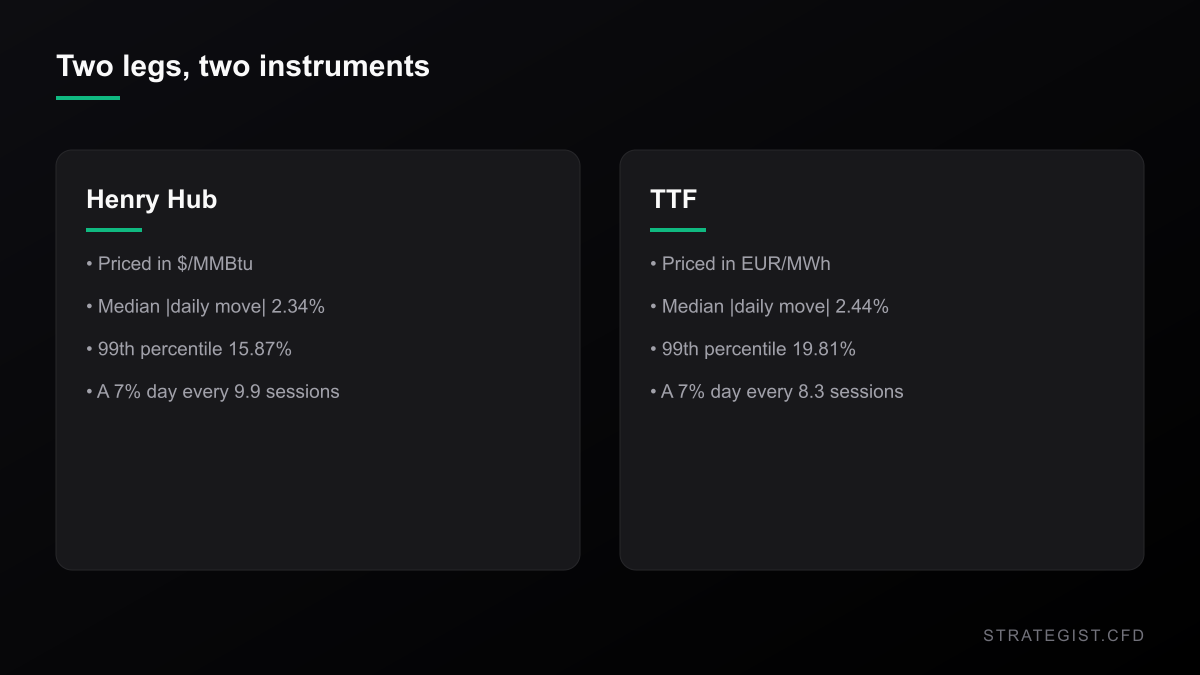
Nothing on a retail platform lets you hold TTF minus Henry Hub as a single position. What you would actually be running is two naked legs in two different instruments, quoted in different units, with different contract sizes, different roll calendars, different margin rates and different spreads.
The financing is the part that is easy to forget. Holding both legs for 20 days at a 6.5% nominal annual financing rate costs about 0.36% of notional per leg — 0.72% for the pair — before either leg has moved. Against a ten-session drift of +3.31% that is survivable. Against the 6.97% daily standard deviation of the ratio itself, it is a rounding error next to the noise you have to sit through to collect it.
The tradable expressions
If the spread itself is not accessible, what is? Measured over the same window:
- Henry Hub (NG=F): median absolute daily move 2.34%, 99th percentile 15.87%, and a move of 7% or more on 201 of 1,981 sessions — roughly one every ten sessions.
- TTF (TTF=F): median 2.44%, 99th percentile 19.81%, and a 7% day on 240 sessions — one every eight.
- Cheniere Energy (LNG), the listed owner of the export infrastructure that earns the spread: regressing its daily returns on Henry Hub’s gives a slope of 0.047 and an r² of 0.011 over 2,194 sessions. Its r² against WTI is 0.097. The company that physically owns the bottleneck is, at daily frequency, almost unrelated to the price of the molecule it moves.
That last number is the useful one. It says the export bottleneck is a business, not a proxy: buying the infrastructure is not the same trade as buying the spread.
Caveats
Every figure here is descriptive statistics computed on 2026-09-29 from the Yahoo Finance continuous futures series (NG=F, TTF=F), EURUSD and Cheniere Energy, converted at 3.412 MMBtu per MWh. It is not a backtest and not a strategy. Two limitations matter most. First, Yahoo’s continuous futures series can sit roughly 1% away from the cash or contract price quoted in news reports, so the levels are used here for shape, ratios and distributions — never as a quoted market price. Second, the whole study is in-sample: the ratio’s median, its percentiles and the event-study drifts are properties of the same nine years they were measured on, and both the 2020 inversion and the 2022 spike sit inside that window. The cost figures are stated assumptions, not broker quotes. No live account and no funded track record is being claimed.
More in News
 News2026-09-27
The Gold Rule of Thumb Says $4,000. The Market Says $4,321.
Kitco's rule of thumb says a 5.18% ten-year yield should have gold well below $4,000. I ran that number against 26 years of daily bars. The slope was never stable — and gold's beta to the S&P is now +0.65, which is why the hedge stopped hedging.
 News2026-09-26
Copper Set a Record High While 696,000 Tonnes Sat in New Orleans
Three-month copper came within $92 of its record while Shanghai cathode stocks fell to a three-year low and Comex warehouses held 69% of all exchange metal. The tightness is real — it is just not where the chart is. And the breakout trade that paid from 2000 to 2019 has not paid since 2020.
 News2026-09-26
The 10-Year Is at a 2007 High. The Carry Is the Trade.
The 10-year Treasury closed at 5.184%, the highest since July 2007 — and the S&P still finished the week up 1.21% with the VIX under 15. The stock-bond correlation has flipped sign since 2007, and the part of that which is not a forecast is the carry: it eats a forex setup's 0.6R target in about thirteen days.