Nasdaq Up 3%, Dow Down 3.5%: What a Split Month Does to Your Stop
The tape, mid-afternoon in New York
Core PCE came in at 3.0% for August, unchanged from July and well under the 3.3% the street had penciled in. Headline PCE ran 3.4%. On paper that is a clean risk-on print. What actually happened was lopsided: the Nasdaq 100 up 0.83%, the S&P 500 up 0.53%, the Dow down 0.10%, and the 10-year yield up roughly four basis points to 5.293%. One data release, three different markets.
The detail that matters more than any of those numbers is underneath. Five of the nine sector SPDRs were down. Tech was up 1.06% and energy up 0.72%; consumer discretionary and materials were barely positive. Financials were down 0.67%, industrials down 0.59%, staples down 0.54%, health care down 0.28%, utilities down 0.14%. The index rose because the sector that rose carries the most weight, not because the market agreed with itself.
September split the tape in two
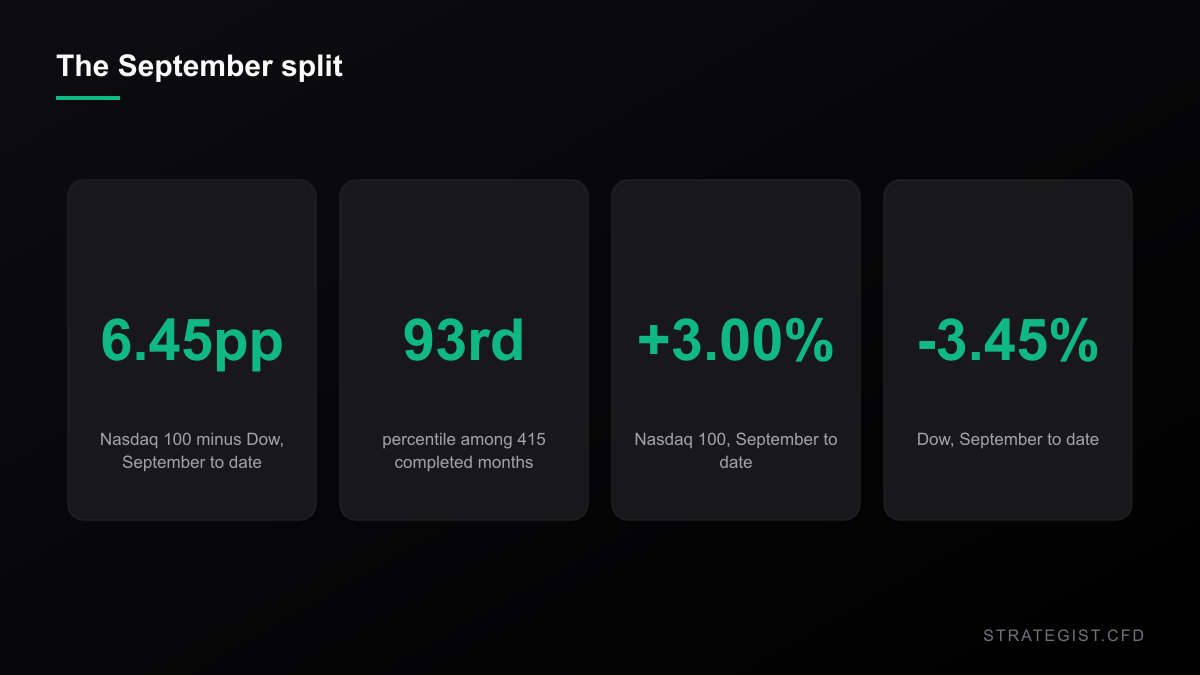
Through Tuesday's close, the Nasdaq 100 was up 3.00% for September and the Dow was down 3.45%. The S&P 500, sitting between the two, was down 0.20%. That is a 6.45 percentage point spread between two US large-cap indexes inside a single month.
I ran month-end closes back to February 1992, 415 completed months. Only 27 of them, 6.5%, were wider. The company it keeps is the interesting part: February 2000 at 26.9 points, December 1999 at 19.3, December 1998 at 17.1, October 2001 at 14.2. The widest splits in modern market history cluster inside the dot-com unwind, and September 2026 has just joined them. The median September in that sample has a gap of 0.64 points.
Two conclusions follow, and they pull in opposite directions. The first is that "the market" isn't something you can be long or short. A CFD ticket on US30, NAS100 or SPX30 is a bet on one particular weighting scheme, and in a month like this one the schemes disagree by more than six points. The second is that the gap itself tells you almost nothing about which one to pick. More on that further down.
An index is a weighted vote, not a headcount
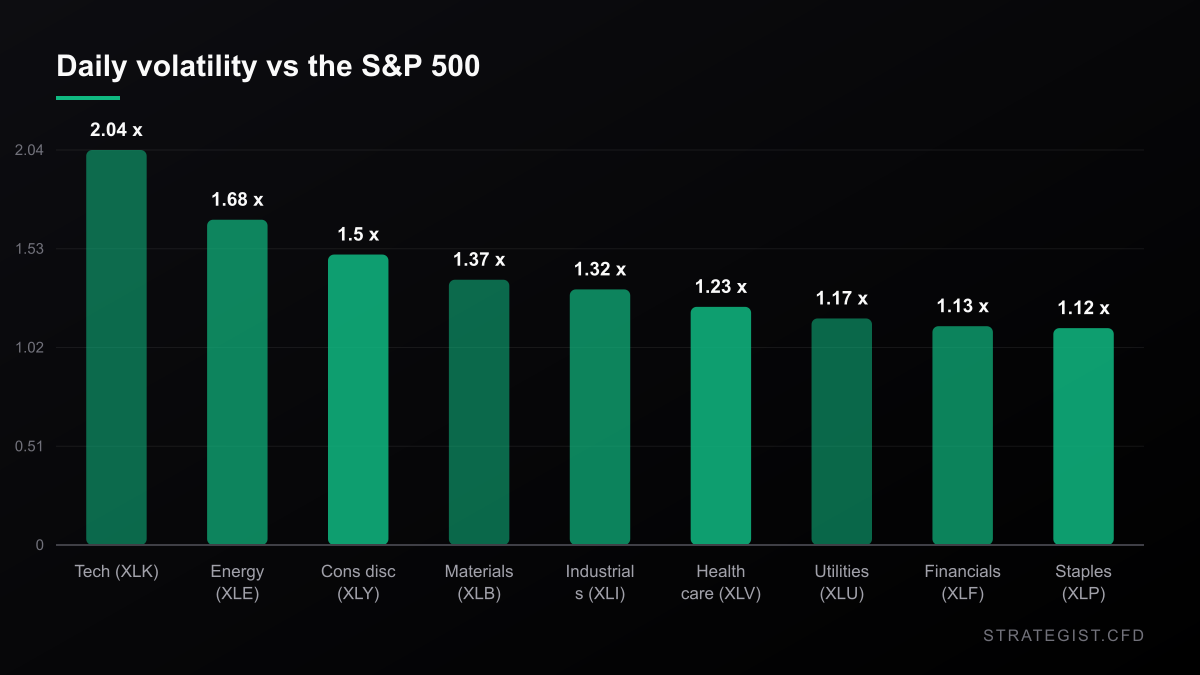
Over the last 252 sessions the tech sector's daily returns have been 2.04 times as volatile as the S&P 500's: 1.66% standard deviation against 0.82%. Energy is 1.68x, consumer discretionary 1.50x, staples 1.12x. Regress the index's daily return on the tech sector's return alone and you get an r-squared of 0.724, meaning one sector explains roughly 72% of the day-to-day variance of the whole index.
That asymmetry is why breadth can fall apart without the index noticing. When the heaviest component moves 1% and the other eight do approximately nothing, the index prints a gain and five sectors print a loss. If you watched the index chart on Wednesday you saw a green day. If you were long across the market, you probably didn't have one. Before assuming two index positions count as diversification, check the actual overlap:
Correlation Matrix
Analyze the statistical relationship between different assets to avoid over-exposure.
One note on the day's other headline. Barron's had chips "not helping," and for Wednesday that was fair: the semiconductor ETF was up 0.36% while the tech sector was up 1.05%. Zoom out and the picture flips. Across 2026, semis have closed higher on 93.0% of the days the Nasdaq ETF rose, against an 81.0% hit rate since 2000. That is the highest participation rate of any year in the sample. A single session of underperformance is not a rotation, and it's not a thesis.
Dispersion tells you the size of the next move, not its direction
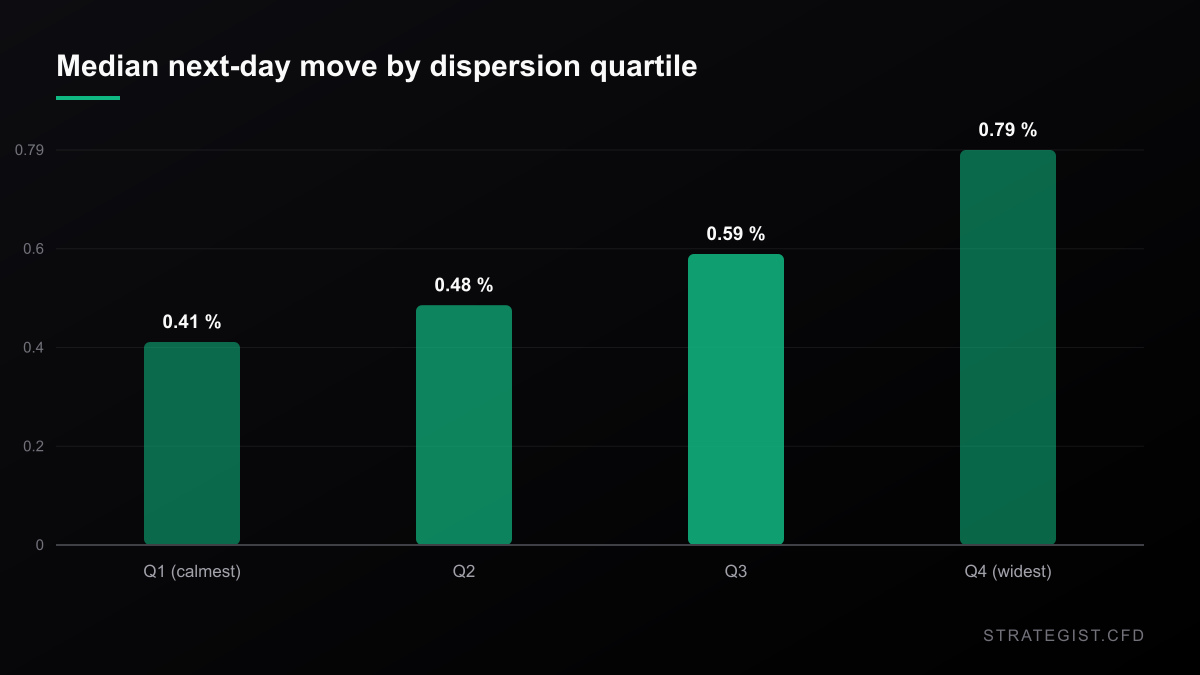
So I measured it. Using the nine sector SPDRs I computed a dispersion score for every session since December 1998: the cross-sectional standard deviation of that day's nine sector returns, in percent. When the nine move together the score is low; when they go their separate ways it's high. That's 6,983 sessions, and I left Wednesday out because the close hadn't happened yet.
Sort those days into quartiles by dispersion, then look at what the S&P did next. The median absolute move the following day runs 0.408% in the calmest quartile and 0.794% in the widest, a 1.95x spread. Over five sessions it's 1.062% against 1.773%. That isn't a subtle effect, and each bucket holds roughly 1,750 observations.
It also persists. The day after a bottom-quartile dispersion day, median dispersion is 0.471%. After a top-quartile day it's 0.956%. The regime doesn't reset overnight, which is what makes it usable: you get more than one session to adjust.
What it does not do is tell you which way. The hit rate over the next 20 sessions falls from 67.7% in the calmest quartile to 57.3% in the widest. There's a tilt, but it's modest, and it's tangled up with the volatility effect: dispersed days cluster inside stressed periods, and stressed periods have delivered weaker forward returns for reasons that have nothing to do with breadth. Use dispersion as a sizing input, not as a signal.
Narrow rallies pay less
Restricting to up days sharpens the picture. Of the 3,740 sessions where the S&P closed higher, 383 had four or fewer of the nine sectors agreeing: the index rose while most of the market didn't. Those days were followed by a median 20-day gain of 0.67%, and only 58.1% of those 20-day windows ended green.
Compare that with the 1,670 up days where eight or nine sectors agreed: a median 20-day gain of 1.34%, positive 65.2% of the time. Roughly double the median payoff from the same directional signal.
And 2026 has been full of the narrow kind. Of the 96 up days so far this year, 24 — a quarter of them — had four or fewer sectors participating. The long-run rate is 10.2%. The only years that come close are 2000 at 21.7%, 2024 at 20.3% and 1999 at 19.4%. Median dispersion for 2026 is 0.935%, the highest since 2008 and the fourth highest across twenty-eight years of data.
If your index longs have felt like they're working harder for less this year, that isn't imagination.
What that does to your size
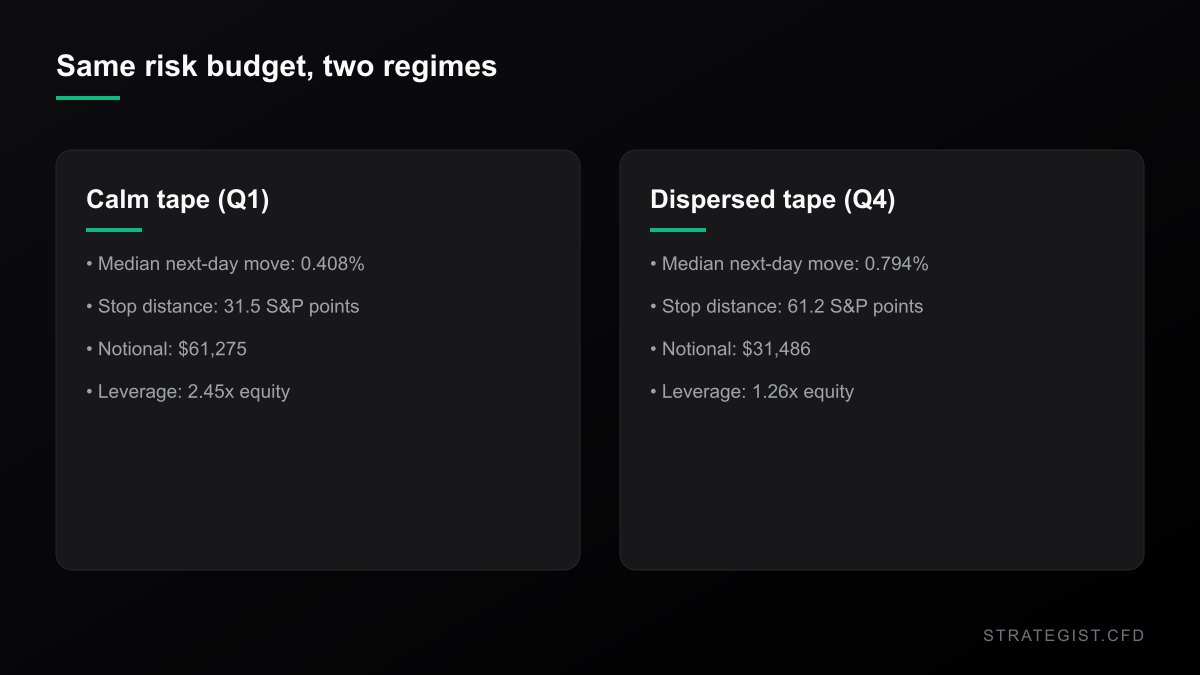
Here is the part that reaches your P&L. Position size equals risk budget divided by stop distance, and stop distance should scale with the tape. Take a $25,000 account risking 1% per trade, so $250, and place the stop one median daily move away.
In the calmest quartile that median move is 0.408%, which at 7,711 on the S&P is about 31.5 points. $250 divided by 0.408% buys you $61,275 of notional, or 2.45x your equity. In the widest quartile the median move is 0.794%, about 61.2 points, and the same $250 buys $31,486, or 1.26x your equity.
Same account, same risk budget, same signal. You give up 48.6% of your exposure because the tape got noisier. That's the whole point: the risk you defined hasn't changed, the distance you need to survive has. The alternative, keeping the notional and widening the stop anyway, is how a 1% risk budget quietly turns into a 2% one. Run your own numbers through the
Risk Analyzer
Quantify event-specific risks and calculate potential impact on your portfolio.
Why Position Sizing Matters More Than Entry Signals
Entry signals decide where you trade; position sizing decides whether you survive. Why capital allocation dominates entry precision in leveraged CFD markets, and how to build a sizing rule you can actually follow.
Where this breaks
Three honest problems. First, the gap is not a trade. I tested it both ways. After a top-decile daily spread between the Nasdaq 100 and the Dow, roughly 1.07 points or more, the median relative performance over the next five sessions is 0.250 points in the Nasdaq's favor against an unconditional 0.175, and it's positive 52.2% of the time versus 54.7% unconditionally. At the monthly horizon: after a top-decile spread the next month's median gap is 1.13 points against 0.51 unconditionally, positive 53.7% versus 54.7%. That is noise wearing an edge's clothing. Knowing the tape is split doesn't tell you which half wins.
Second, dispersion is partly just volatility in a different hat. Nine sectors disagreeing more is mechanically close to saying the market is moving more, so the weaker forward returns after dispersed days may be a volatility-regime effect rather than a breadth effect. I can't separate the two with this data and neither can you.
Third, nine sector ETFs are a rough proxy for breadth. The real S&P 500 holds 500 stocks across eleven sectors, and a genuine advance-decline line would be sharper. I used what is freely downloadable and consistent back to 1998.
What to do with it
- Measure before you size. If the nine sector returns aren't something you look at, the index chart is hiding the one thing that decides whether your stop survives.
- Move size with dispersion, not direction. A larger median daily move means a wider stop for the same structural idea, which means less notional for the same risk budget.
- Hold the adjustment for several sessions. The regime persists: median next-day dispersion is 0.956% after a wide day against 0.471% after a calm one.
- Choose your index deliberately. NAS100, US30 and SPX30 are different instruments with different sector weights, and this month they diverged by more than six percentage points.
- Don't trade the gap. The spread between two indexes carries almost no forward information about which one leads next.
How I measured this
Daily closes pulled from Yahoo Finance through the yahoo-finance2 package: ^GSPC, ^NDX, ^DJI and the nine sector SPDRs (XLK, XLF, XLE, XLV, XLI, XLY, XLP, XLU, XLB). The sample runs 1998-12-23 to 2026-09-29, 6,983 sessions; the 2026-09-30 bar was excluded because the session was still open when this ran. Returns are price returns, which is the right frame for index CFDs since they track the price index rather than a total-return version. Dispersion is the cross-sectional standard deviation of the nine sector returns on each day. Forward statistics are plain historical sorts with no transaction costs, no slippage and no financing: they describe what happened, not what a strategy would have earned.
Charts and analysis on this site are for research only and are not investment advice.
More in News
 News2026-09-29
Silver Is 47% Below Its January Peak. The Leverage Is an Illusion.
Silver fell 4.7% on Monday while gold fell 3.5%. I ran 6,539 sessions of COMEX data to see whether silver really is leveraged gold. It is 2.28x as volatile, but it only delivers about 1.35x on the days gold actually moves.
 News2026-09-29
Henry Hub vs TTF: The Same Molecule Priced Twice
US gas at $2.90/MMBtu against European gas at EUR 78/MWh is a factor of nine. Measured across 1,982 sessions, the spread has a median of 3.4x, a daily-return correlation of 0.13, and more volatility than either leg.
 News2026-09-27
The Gold Rule of Thumb Says $4,000. The Market Says $4,321.
Kitco's rule of thumb says a 5.18% ten-year yield should have gold well below $4,000. I ran that number against 26 years of daily bars. The slope was never stable — and gold's beta to the S&P is now +0.65, which is why the hedge stopped hedging.