The S&P Lost 1.82% on Friday. 64% of It Was Priced Before the Bell.
Strategist
October 31, 2026
10 min read
The last session of October settled one thing about Friday's sell-off. Almost none of it happened while you were awake.
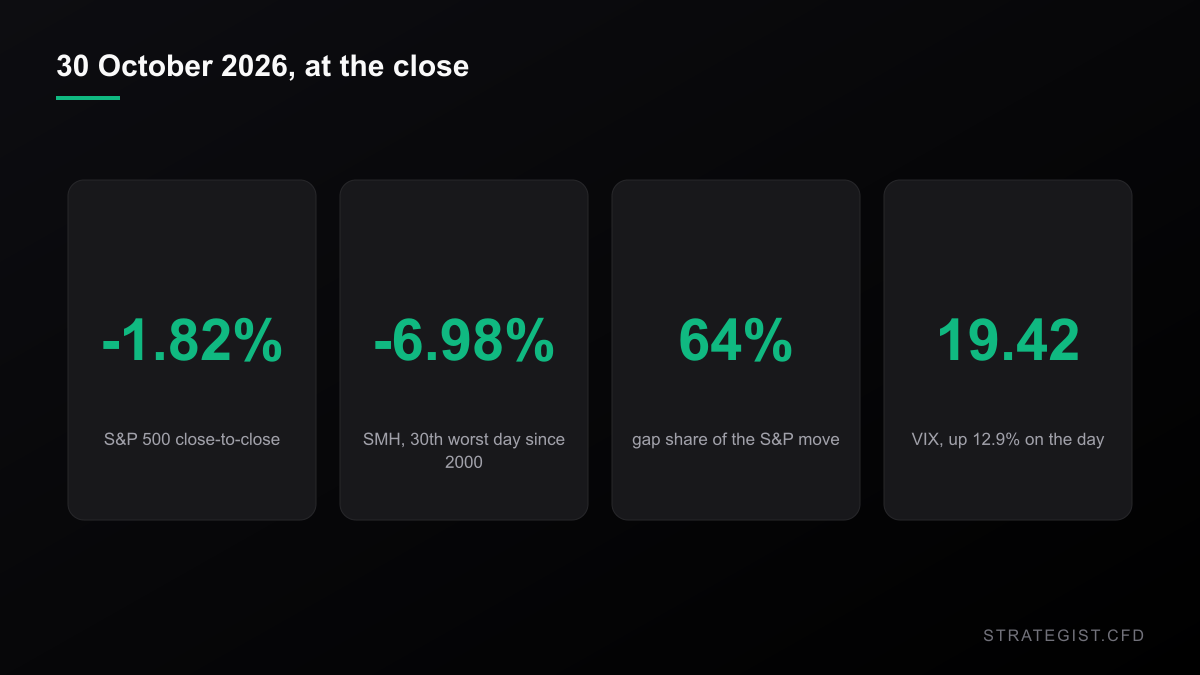
On 30 October 2026 the S&P 500 closed at 7,580.07, down 1.82%. The Nasdaq 100 lost 3.46% and the VanEck Semiconductor ETF (SMH) lost 6.98% — one of only 30 sessions out of 6,640 since June 2000 that bad or worse, and one of two in 2026. Now look at the open. The S&P 500 opened at 7,631.07, already 1.02% below Thursday's close of 7,709.96 (the Yahoo index day bar prints 1.16% because it prices the open slightly differently; intraday bars from the same source give 1.02%). SMH opened at 532.58 against a previous close of 571.48. Most of the loss was in the print before the first five-minute bar had finished.
The tape, as it closed
Session close, 30 October 2026. Gap share is measured against the close-to-close move.Session close, 30 October 2026. Gap share is measured against the close-to-close move.
Three numbers describe Friday better than the percentages do. The overnight gap was 64% of the S&P's move — and where the overnight share jumps to 74% is the semiconductor ETF, not the index. Across 7,251 sessions since 1998 there were 554 days where the S&P closed 1.5% or worse, and the gap was the larger half of the move on just 25 of them — 4.5%. The mean gap on those 554 days was -0.26% against a mean open-to-close of -2.20%. Friday was one of the 25.
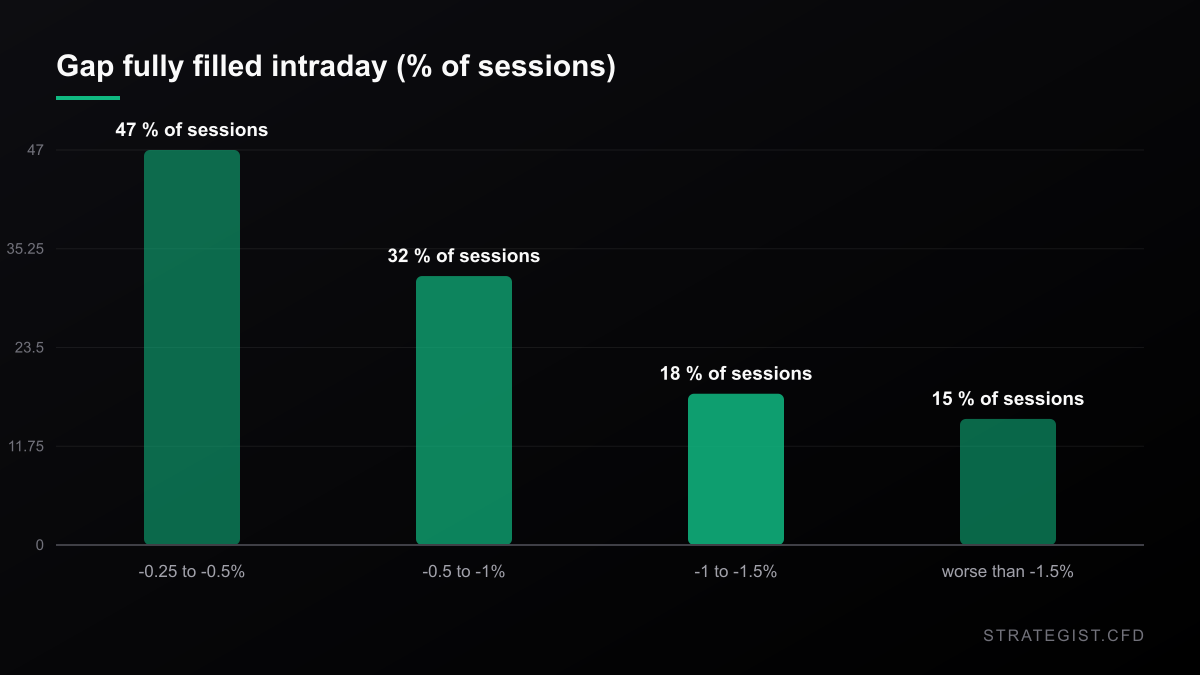
637 gap-down sessions since 1998. The bigger the hole, the less often the market refills it.
The second number is what happened after the bell. The S&P never got back above 7,637.48, eight points above its open, and it spent the last hour sliding to the low of the day at 14:50 New York. SMH's high was 535.32 at 09:35 — five minutes in — and it never traded higher again.
The third number is the one that matters if you were long with a stop: the low came late. SMH's low of 511.63, 3.93% below the open, printed at 14:35 New York. You had six hours to decide something, and every hour the answer got worse.
Not one exception in sixty sessions
637 gap-down sessions since 1998. The bigger the hole, the less often the market refills it.
I wanted to know how often a gap-down day gives the opening price back, because every trader wants to buy the open or wait for the fill, and every execution note implies the choice is available. In sixty sessions of five-minute data from August to October 2026, SMH traded below its opening print on 60 of 60 days. QQQ: 60 of 60. SPY: 60 of 60. In every single session, a buyer of the open could have had it cheaper at some point.
That is not a coincidence of a quiet period — it is what an intraday range is. The median drawdown from the open in that window was 1.02% for SMH, 0.48% for QQQ and 0.29% for SPY. Even in the calmest bucket, the sessions whose gap was smaller than 0.3% in either direction, every one of the 37 SMH sessions still traded below its open. Chasing the opening print is a systematically worse fill than waiting, and waiting has a cost of its own: you watch the position move against you before it goes anywhere.
On gap-down days the long history says something sharper. Since 1998 the S&P 500 opened 0.25% or more below the prior close on 637 sessions. Of those, 39% fully filled the gap intraday and 41% closed above the open. Scale the gap up and both collapse: on a gap of 1% to 1.5% the fill rate was 18%, and on a gap worse than 1.5% it was 15%, with only 30% of those sessions closing above the open. The bigger the hole, the less often the market refills it. Look at the same split for the semis and the direction reverses: SMH filled the gap on 54% of its 2,245 gap-down sessions, and closed above the open on 50% of them — a coin flip, on a name with four times the index's daily range.
A discount you cannot collect
246 sessions where SMH closed -4% or worse, entry at the prior close. 1998-2026.246 sessions where SMH closed -4% or worse, entry at the prior close. 1998-2026.
Here is the arithmetic the chart hides. The 8 SMH sessions in that window with a gap of 2% or worse had a median move from open to the day's high of +0.81% and a median move from open to the low of -1.06%. Waiting for a retest of the open was profitable 0 times out of 8 — the retest always came, and it always kept going.
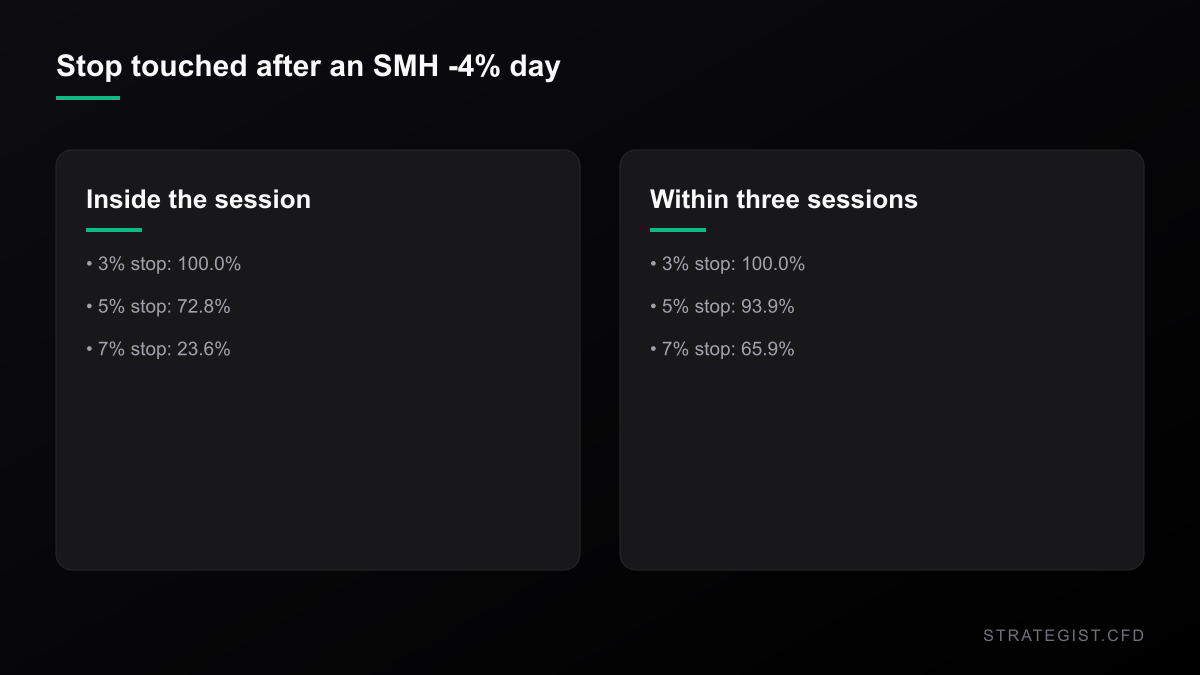
The daily history agrees on direction and is clearer on consequence. Averaging into a gap-down works exactly until it does not, and a stop does not survive the day it is meant for. If you bought Thursday's close on an SMH day that finished -4% or worse, a 3% stop was touched on 100% of 246 such days inside the session itself; a 5% stop on 72.8%; a 7% stop on 23.6%. From that entry the median adverse excursion over three sessions was -8.30%, the tenth percentile -13.54%, and the median favourable excursion over the same window was -0.34% — negative, meaning the median trade never traded above where it entered.
It does not matter what kind of -4% day it was. Splitting the 246 by whether the overnight gap or the intraday move dominated, the three-session median adverse excursion is -8.30% in both groups. The gap decides how the day opens, not how far the trade travels.
Sizing, in ATR rather than percent
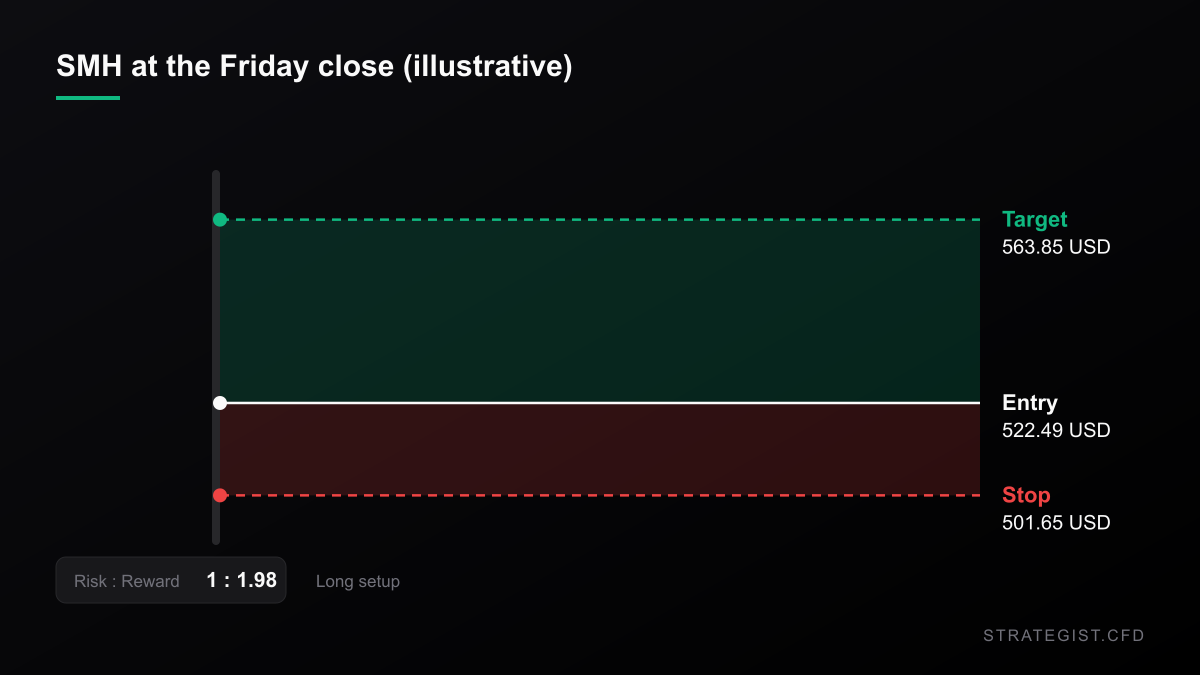
14-session ATR is 20.84 points, 3.99% of price. Target set at 2R from the one-ATR stop. Illustrative, not a trade call.14-session ATR is 20.84 points, 3.99% of price. Target set at 2R from the one-ATR stop. Illustrative, not a trade call.
Take SMH at Friday's close of 522.49 as an illustrative entry, not a signal. The 14-session ATR is 20.84 points, or 3.99% of price. A one-ATR stop sits at 501.65; two ATR at 480.81; three ATR at 459.56. Daily volatility over the last twenty sessions is 2.79%, which is what makes those distances so wide — a 2% stop is not a stop on this instrument, it is a coin flip.
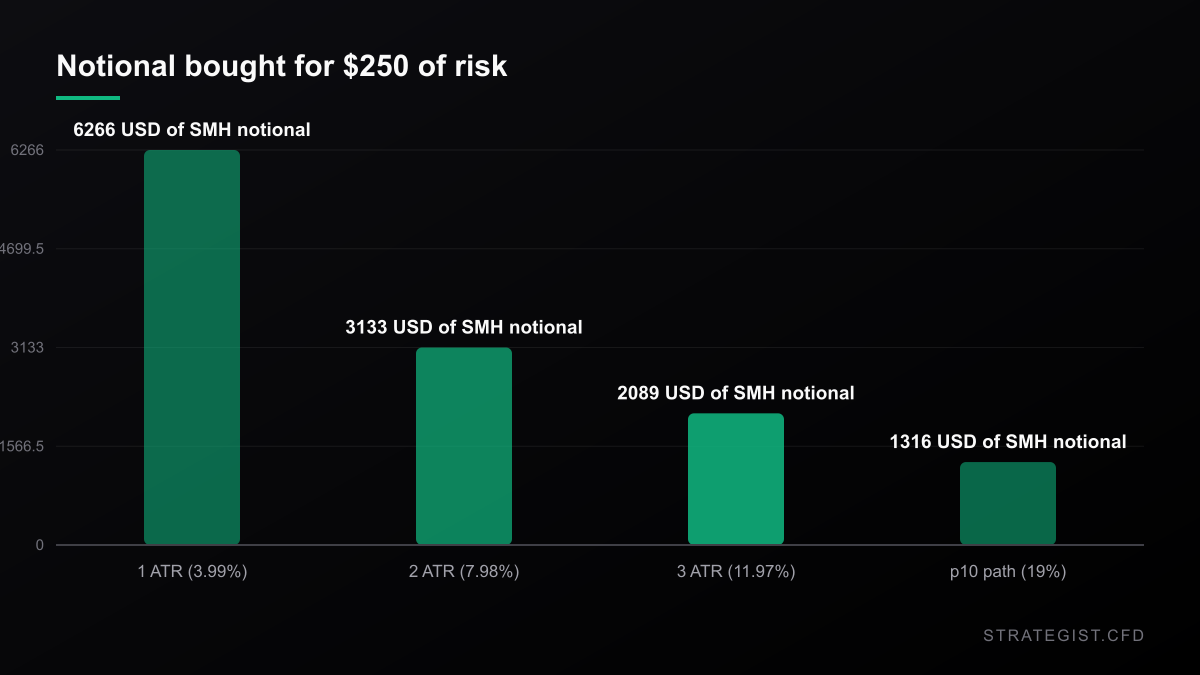
The useful comparison is not stop distance but what the stop costs you in notional. At 1% account risk on a $25,000 account — $250 — a 3.99% stop buys $6,266 of SMH, about 12 shares. A 7.98% stop buys 6 shares. Halving the position to widen the stop is not a smaller bet: it is the same bet with a lower probability of being stopped out before the reason for the trade plays out, which is the only thing that matters on a name moving four percent a day.
Cost is not the obstacle here, and it is worth saying so because the usual advice assumes it is. A two-way cost of 0.10% of notional is 0.025R against a one-ATR stop, which moves the break-even hit rate on a 1R target from 50% to 47.6%. On SMH, spread is a rounding error next to a four-percent daily range.
What Friday's gap did to the relative trade
The other thing Friday settled is the SMH-versus-QQQ spread. Over 21 sessions SMH has underperformed the Nasdaq 100 by 9.12 percentage points, which is the 2.2nd percentile of 6,621 overlapping windows since June 2000 — only 146 windows were worse. In the worst 5% of those windows (n=331), over the following 10 sessions SMH beat QQQ by a median 0.73pp and rose in absolute terms 56% of the time, against a 50.3% baseline. A mild edge, not a dramatic one.
The asymmetry is in the path. After those worst-quintile windows SMH's median adverse excursion over the next 21 sessions was -6.64%, with the tenth percentile at -19.35%, against -3.61% and -12.88% unconditionally. In 58% of those episodes SMH fell more than 5% at some point, against 39% normally. The reversion is real and it is paid for in drawdown.
That is also why "buy the laggard" needs a time scale attached to it. The three-session relative spread is now -2.19pp, the 10th percentile of its own history; the five-session spread is +1.10pp, the 70th. October put the three-day window at an extreme without putting the one-week window anywhere near cheap — the same narrative gives a different answer depending on how far back the screen looks. Only the twenty-one-session window is genuinely stretched, and twenty-one sessions is the most expensive of the three: a mild payoff delivered through a violent path.
There are 331 such worst-quintile windows, each requiring the trailing twenty-one sessions to land in the worst 5%. The sample spans the 2000 unwind, 2008 and 2022, so the 56% hit rate carries several periods when the whole market was bouncing. Read as evidence that laggards come back and you will over-read it; read as evidence that even at the most extreme lag the edge is six points and the median cost of waiting is a -6.64% adverse excursion, and it is useful.
Where the stop has to sit
Put the two halves together and the position becomes uncomfortable. A stop wide enough to survive the 10th-percentile path after a worst-quintile relative window is roughly 19% away. At 1% risk that budgets $1,316 of notional — two and a half shares of SMH — and the median twenty-one session reversion of +1.67% on that notional pays $22, or 0.088R. You are holding a wide, slow position for a tenth of one unit of risk. Set the stop at 2 ATR instead and you have taken a position with a materially shorter half-life than the reversion you are trying to collect.
Same 1% risk, four stop widths. Wider stops buy less SMH — and the reversion that follows pays less.
That is the honest version of the tape. Friday did not hand out a free option; it handed out a wide overnight move, a fill that punished anyone who chased it, and a well-documented reversal tendency that is expensive to hold through. The arithmetic favours the patient buyer, and the patient buyer is paid in drawdown, not in price.
What I measured, and what it does not say
Same 1% risk, four stop widths. Wider stops buy less SMH — and the reversion that follows pays less.
Every figure above comes from daily OHLC for ^GSPC, ^NDX, SMH, QQQ, SPY, IWM and XLE (1998-01-02 to 2026-10-30) and five-minute bars for SMH, QQQ and SPY covering the last 60 sessions (2026-08-07 to 2026-10-30), all pulled from Yahoo Finance during this session. Forward returns are close-to-close over overlapping windows and are not adjusted for survivorship, borrow, financing or the 60-day ceiling on Yahoo's intraday history. The eight-session SMH gap sample is far too small to carry a claim on its own; it is here because it agrees with the 26-year daily record, not because it establishes it. The ATR levels are arithmetic on observed volatility, not levels anyone should expect to hold. Nothing here is a recommendation.
 News2026-10-31
 News2026-10-17
 News2026-10-16