The Nasdaq Just Entered Its Third Correction of 2026. The Closing Price Disagrees.
Three numbers, one afternoon
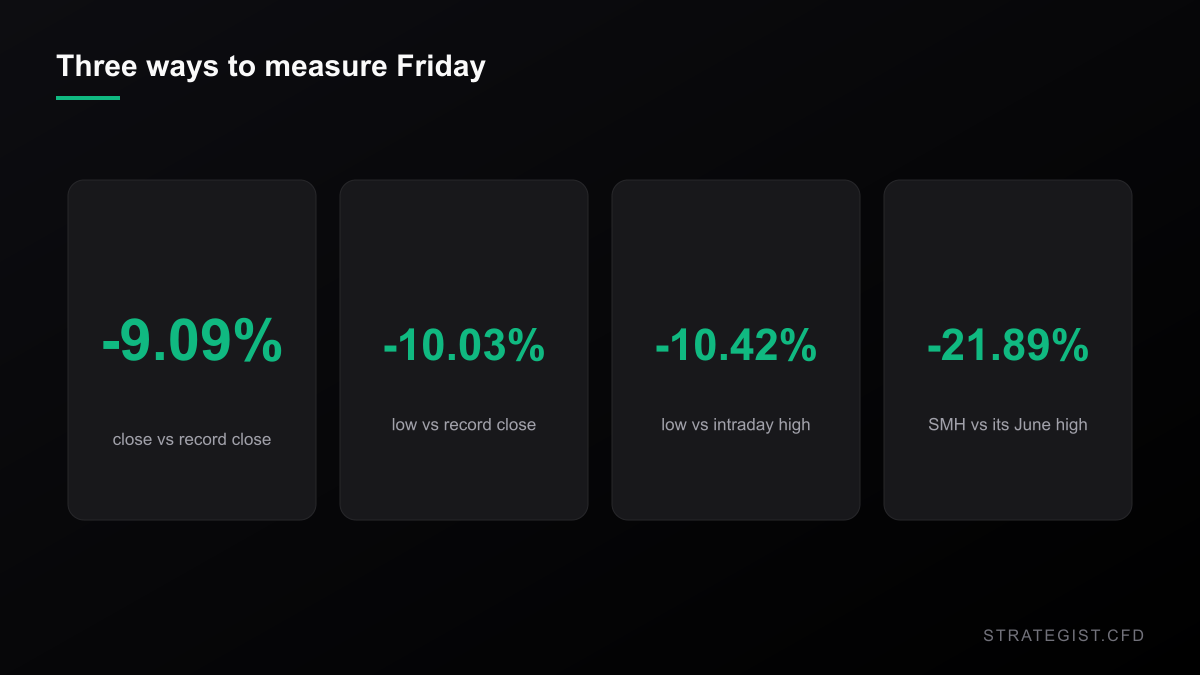
The Nasdaq 100 closed Friday at 28,384.85, down 3.46% on the session. Its last record close was 31,224.47, set on 6 October. Everything after that is division, and the division gives three answers depending on which two prices you pick.
Close against record close: -9.09%. Friday's low against the record close: -10.03%. Friday's low against the record intraday high: -10.42%.
One of those is a correction. One is two basis points short of being one. One is 0.91 percentage points short. Bloomberg counted Friday as the third correction of 2026. Reuters put the October loss in Nasdaq market value at $2 trillion. The New York Times called it the worst day for tech since June, and Hindustan Times reported Intel down roughly 30%. Every one of those statements is defensible. They are not describing the same measurement.
For a CFD trader that distinction isn't pedantry. It's the difference between a position that survived Friday and one that got closed out mid-afternoon.
Your account doesn't close at four
A correction is conventionally defined on closing prices: 10% below a record close. That convention exists because index history is published as daily closes and because it filters noise. It has nothing to do with how your broker treats you.
Margin is marked continuously. A stop order doesn't wait for the closing print. A margin call happens at whatever price the desk marks you. So the drawdown that matters to your equity is the intraday one, and on Friday that was -10.42%, not -9.09%.
Friday isn't unusual in this respect. Measured as the intraday low against the running record close, the Nasdaq 100 has produced 193 sessions since 1985 where the low was at least 10% under the high-water close but the close itself was not. The correction existed for the length of the cash session and then it didn't.
How often a correction fails to confirm
Take the strict version — intraday low against the intraday record high. Since October 1985 the Nasdaq 100 has entered 108 separate episodes of trading 10% or more below its high. In 67 of them the index eventually produced at least one close that low. In the other 41, or 38.0%, it never did.
Friday's -9.09% closing drawdown ranks 13th deepest among those 41 non-confirming episodes, dead level with 12 June 1998 and 11 October 2018, which also bottomed at exactly -9.09%. Not a record and not an anomaly. Just short.
The definition also decides what gets counted at all. On 2 April this year the index traded down to 9.98% below its record close — two basis points. It appears in nobody's list of 2026 corrections, which is part of why October is being called the third rather than the fourth.
The parts of Friday that weren't dramatic
Here's what should temper the panic framing. The VIX closed at 19.42. Since 1990 that is the 60th percentile; the median reading is 17.57. Elevated, not extreme.
QQQ's 14-day average true range is 2.02% of price. That's the 66th percentile since 1999 against a long-run median of 1.62%. It is also lower than it was in early August, when it printed 2.18%.
And Friday's intraday low ran 1.33 percentage points below its close in drawdown terms. The median session that closes between 8% and 10% below a high runs 1.48 points deeper than its close. Friday was calmer than the typical day at that depth: it sold off hard and didn't churn.
The chips peaked in June. The index peaked in October.
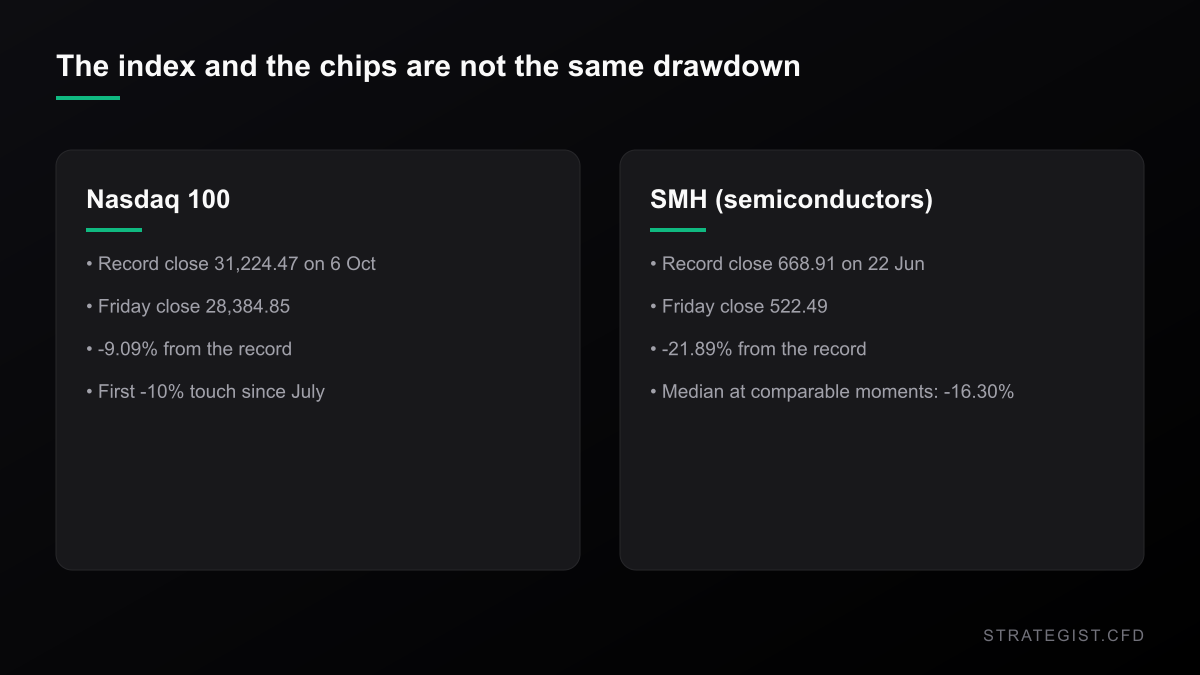
Take the index drawdown at face value and you miss where the damage actually is. SMH, the semiconductor ETF, closed Friday at 522.49 — -21.89% from its record close of 22 June. The index is 9% off its high; the chips inside it are 22% off theirs, and they topped more than three months earlier.
That gap has precedent, but today it's wide. Since 2000 there have been 43 moments when the Nasdaq 100 first traded 10% below its intraday high. At those moments SMH was already down a median 16.30% from its own record close. Today's -21.89% is worse than that — 14th deepest out of 44 observations.
So these are not the same trade. Buying the index here is buying something 9% off its high with volatility at two-thirds of its historical range. Buying semis here is buying something that has been in a bear market since June.
What happened the previous 107 times
From the close of the first day of each of those 108 episodes, the forward record looks generous: median +2.81% over 21 sessions (61% higher), +8.55% over 63 sessions (81% higher), +14.88% over 126 sessions (83% higher).
Now the number that decides whether you get to collect any of it. The median worst adverse excursion over the next 21 sessions was -4.79%. One time in ten it was worse than -15.12%. The worst case in the sample was -31.12%.
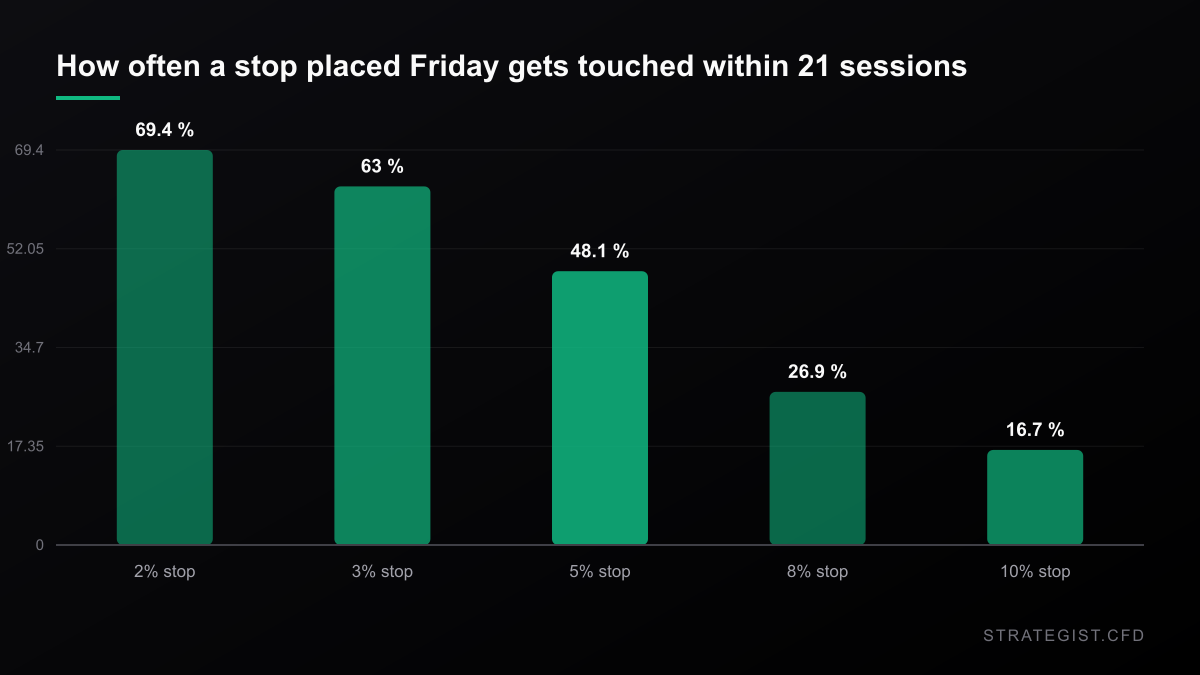
Translated into stops, entering at Friday's close and holding:
- 2% stop — touched in 69.4% of cases within 21 sessions
- 3% stop — 63.0%
- 5% stop — 48.1%
- 8% stop — 26.9%
- 10% stop — 16.7%
A 3% stop on a long entered Friday gets touched roughly two times in three, on the way to a six-month median outcome of +14.88%. That is the whole problem with trading a drawdown headline: the direction can be right and the position still can't survive the path.
Risk Analyzer
Quantify event-specific risks and calculate potential impact on your portfolio.
Size off ATR, not off the drawdown
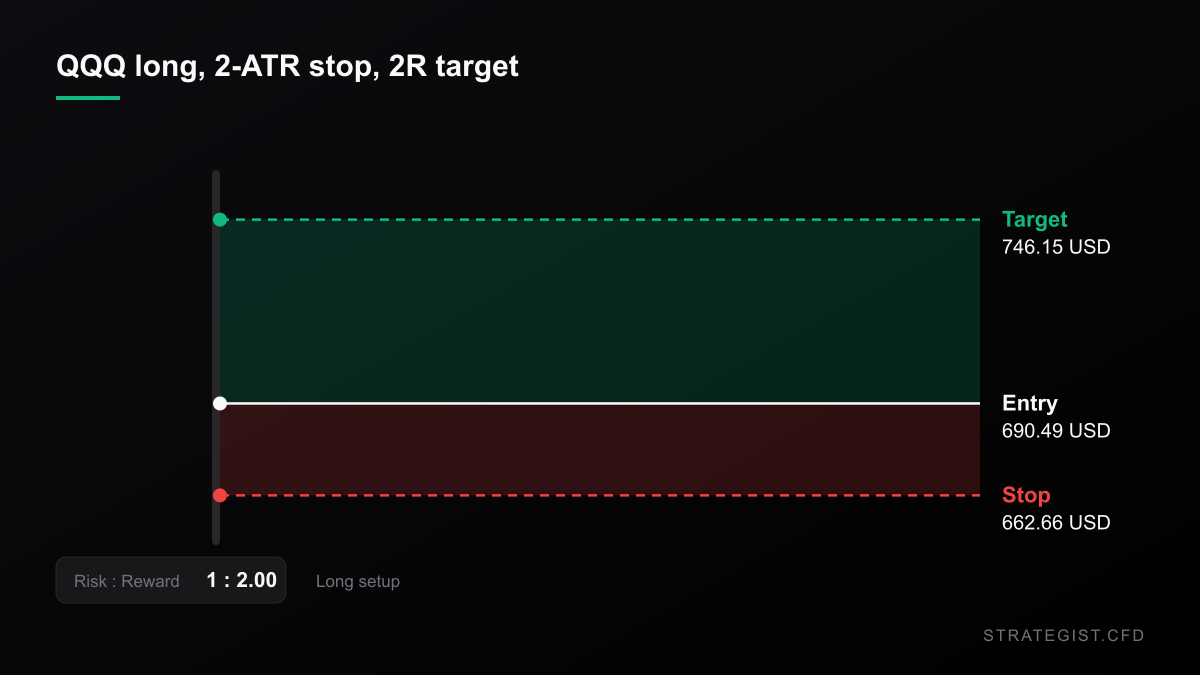
The drawdown figure is not a sizing input. Volatility is. QQQ's 14-day ATR is 2.02% of price, so a 2-ATR stop sits 4.03% away.
On a $50,000 account risking 1% — $500 — that stop buys $12,403 of notional, about 17 QQQ units. Against the long-run median ATR of 1.62%, the same 1% risk would have bought $15,452. The wider stop costs you roughly a fifth of your position size, which is the correct trade-off rather than a bug.
Note the counterintuitive part. Three months ago, with ATR at 2.18%, that same $500 would only have bought $11,458. Today you are allowed slightly more exposure than you were in early August, despite the headlines.
Holding costs are not the binding constraint. At a three-month T-bill rate of 3.973% plus a 2% broker markup, 21 sessions on $12,403 of notional costs about $61.74 — roughly 0.12R. Stop distance dominates; financing doesn't.
If you're carrying several correlated tech positions at once,
Correlation Matrix
Analyze the statistical relationship between different assets to avoid over-exposure.
Where this falls apart
Some honest problems with everything above.
First, 10% is arbitrary. No mechanism flips at -9.09% versus -10.03%. Treating the word correction as an event is a convention, and I've just spent a thousand words measuring it as though it were a fact. It isn't.
Second, the samples are small and clustered. The 41 non-confirming episodes bunch into 1998-2000, 2015, 2018 and 2023 — nine of them happened in 2018 alone. The current episode has exactly one bar in it, Friday, and may still confirm on a close next week. Nothing here is settled.
Third, the forward numbers are conditioned on drawdowns in an index that has risen for four decades. A 126-session median of +14.88% partly reflects that the sample includes the 2009 and 2020 rebounds. It isn't evidence that buying Friday's close is a good idea; it's evidence that the Nasdaq goes up.
Fourth, the stop-hit rates assume you enter at Friday's close, hold a fixed percentage stop and never re-enter. Real execution adds spread, financing, and the fact that your CFD price is not the index.
Fifth, the data is daily bars from Yahoo Finance for ^NDX, QQQ and SMH. Index levels aren't tradeable and closing prints vary slightly by provider.
What to actually do with it
- Pick one drawdown definition and write it down. If your journal says correction while your broker acts intraday, you'll keep being surprised by liquidations the closing chart says shouldn't have happened.
- Size from ATR, not from the headline number. 2.02% today versus 2.18% in August: the tape is telling you it's calmer than the coverage is.
- Separate the index trade from the chip trade. -9.09% and -21.89% are different positions with different stop requirements. See
Why Position Sizing Matters More Than Entry Signals
Entry signals decide where you trade; position sizing decides whether you survive. Why capital allocation dominates entry precision in leveraged CFD markets, and how to build a sizing rule you can actually follow.
The S&P Lost 1.82% on Friday. 64% of It Was Priced Before the Bell.
Semis fell 6.98%, the S&P 1.82%, and most of the move was an overnight gap. What the split between the gap and the session says about stop placement, fills and the one trade Friday actually set up.
Charts and analysis on this site are for research only and are not investment advice.
More in News
 News2026-10-17
Oil Hit $110 and the Nasdaq Had Its Worst Week in 18 Months. That Pair Has No Precedent.
Brent closed at $109.86 on Friday and WTI gained 10.41% on the week. The Nasdaq 100 fell 5.49% over the same five sessions. In 1,084 weeks of data that pairing has never happened — here is what it means for a leveraged book.
 News2026-10-16
Everyone Expects a Fed Hold on 28 October. The Range Doesn't.
Kevin Warsh gave the market nothing last week and traders pushed October hike odds below 30%. The decision lands 2:00 PM ET on Wednesday 28 October. Two thirds of FOMC meetings since 2015 ended with no change - and those days still ran a range about a quarter wider than normal.
 News2026-10-15
Dow Up 424 Points, Nasdaq Down Four Straight: What Rotation Days Do to a CFD Book
The Dow rose 424 points while the Nasdaq 100 fell for a fourth session. Eighteen of thirty-one Nasdaq names went up anyway. Here is what rotation days do to stops, hedges and carry.