Dow Up 424 Points, Nasdaq Down Four Straight: What Rotation Days Do to a CFD Book
At 1:05 in the afternoon in New York on Thursday, the Dow was up 424 points at 52,045.80. The Nasdaq 100 was down 0.70% for the fourth session running, at 29,740.99. The S&P 500, which holds both of them, was up 0.05% at 7,722.77 — a number that tells you nothing except that two very large things were moving in opposite directions underneath it. Underneath the index level the split was violent: XLK down 1.43%, XLV up 2.51%. Both are the stock market, four points apart in one session.
Earlier that morning the September producer price index came in at +1.3% on the month, the biggest monthly advance since March 2022, taking the annual rate to 6.3%. Two sessions earlier, CPI printed 3.7%. Two hot prints in three days, a ten-year yield at 5.09%, and a market that answered by selling semiconductors and buying healthcare.
If you trade index CFDs, this is the tape where the shortcuts stop working.
The parts didn't get the memo
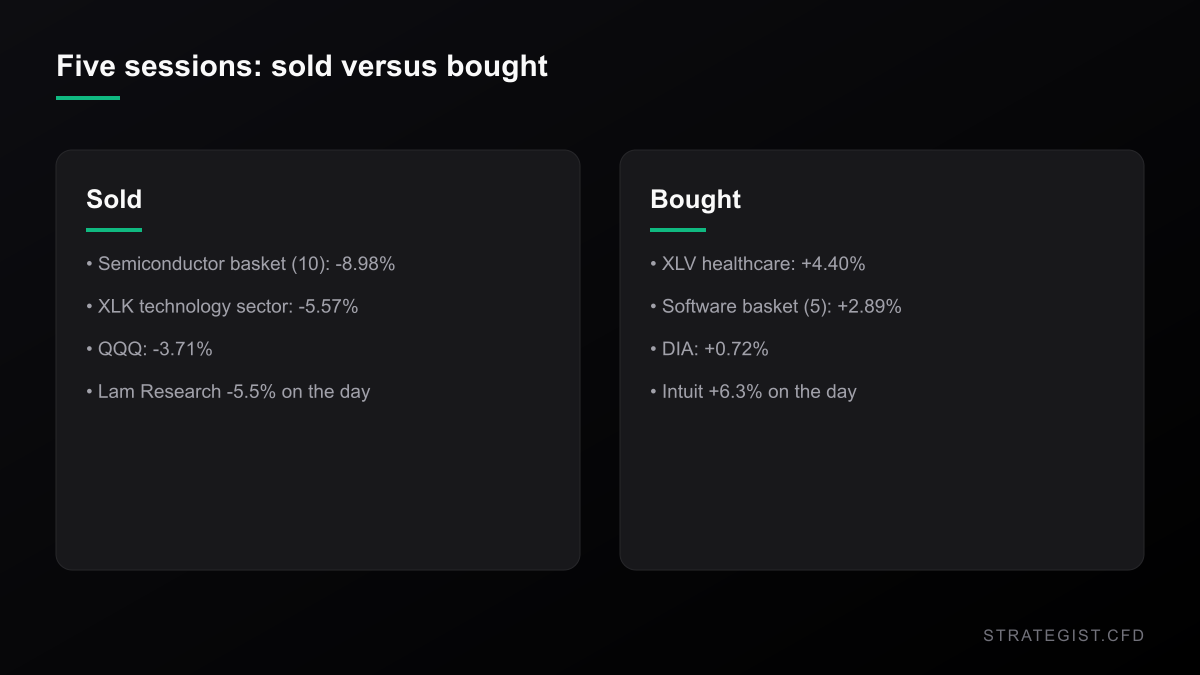
Here is the number that should change how you read the day: of thirty-one large Nasdaq names I pulled, eighteen were higher on Thursday while the index fell 0.70%.
Split them by what they do and the picture sharpens. A ten-name semiconductor basket — NVDA, AVGO, AMD, INTC, QCOM, TXN, MU, AMAT, LRCX, KLAC — was down 2.74%. A five-name software basket — MSFT, ADBE, INTU, CRM, ORCL — was up 3.49%. That is a 6.23 point gap inside one index on one day. Back to May 2012, only about four sessions in a thousand have produced a wider gap between those two baskets; Thursday sits in the worst 0.4%.
Over five sessions the split compounds: semis down 8.98%, software up 2.89%.
A Nasdaq 100 CFD is a position in the weighted average of all of that, and on a day like Thursday the average conceals more than it reveals.
Rotation days are rarer than the calendar suggests
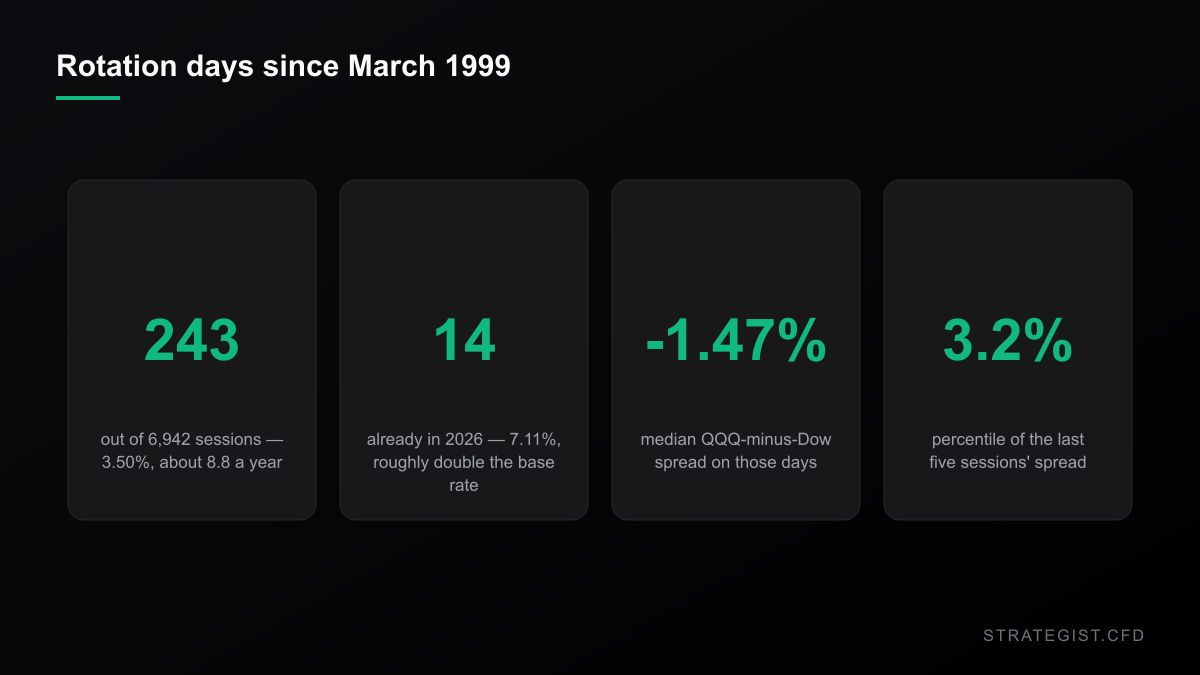
I went back through every session since March 1999 and paired the daily returns of QQQ and DIA: 6,942 trading days. Call a rotation day one where the Dow proxy closes up at least 0.25% and the Nasdaq proxy closes down at least 0.25%.
There have been 243 of them — 3.50% of all sessions, about 8.8 a year. The median spread on those days is -1.47 points, and the median absolute daily spread between the two is 0.459%, smaller than the median absolute move of either index alone.
What is unusual is 2026. Fourteen of the 197 sessions so far this year have been rotation days: 7.11%, roughly double the long-run rate, the most recent on 12 October. Stretch the window to five sessions and this week is in the 3.2 percentile of all 6,938 such windows since 1999: QQQ -3.71%, DIA +0.72%, a spread of -4.43 points. Even so, the Nasdaq's own five-session return is only at the tenth percentile — this is not a crash, it is one index handing back 3.7% while another drifts higher, and anyone holding both barely noticed.
The rotation tells you nothing about next week
This is where I have to talk myself out of the obvious trade. If rotation days are real, and this week has been an extreme one, the natural conclusion is that they keep going.
On the medians, they don't. After the 243 rotation days since 1999, the forward spread between QQQ and DIA has a median of +0.01% over one session, +0.17% over five, +0.77% over twenty and +1.27% over sixty. The unconditional medians for the same horizons are +0.05%, +0.17%, +0.50% and +1.56% — the same numbers inside the noise. The share of occasions on which the spread keeps widening is 49.4% at one day and 44.2% at twenty: a coin flip, tilted if anything toward reversion. Narrowing to the 388 occasions when the four-session spread was already -3% or worse does not rescue it — median forward spread +0.46% at five sessions, -0.32% at twenty, -1.24% at sixty. Not an edge, just a distribution with no memory.
So the useful content of Thursday is not a forecast. It is a statement about where risk is concentrated.
What rotation does to a stop is not what it does to the index
Using the same thirty-one names from May 2012 onward, I compared the cross-section on the 108 rotation days in that window against the other 3,513 sessions. The median absolute move of a single name barely changes: 0.98% on rotation days versus 0.93% otherwise. But the share of names closing higher falls from 54.8% to 38.7%, and the median gap between the best and worst name widens from 6.97 to 7.88 points. The moves don't get bigger. They stop agreeing with each other.
That is precisely the environment that eats stops. Measuring how far each name traded below the previous close: on a normal session, a median of 3.2% of the thirty-one names dip 3% or more below the prior close at some point in the day. On rotation days it is 19.4%, six times as many. Nothing on your index chart warned you — the Nasdaq 100 was down less than one percent.
Correlation Matrix
Analyze the statistical relationship between different assets to avoid over-exposure.
What a long Dow, short Nasdaq pair actually removes
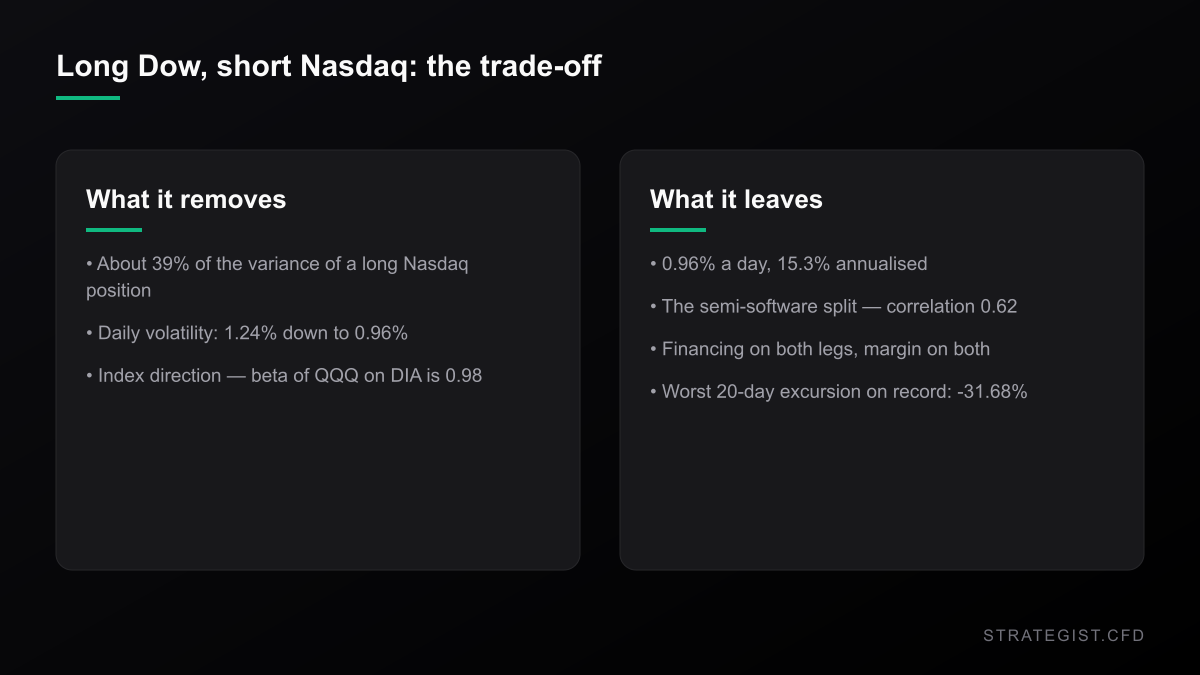
The reflex on a day like Thursday is to build the hedge: long the Dow, short the Nasdaq, collect the spread, sleep at night. It deserves to be priced properly. Over the last 250 sessions the daily correlation between QQQ and DIA is 0.628; over the full sample back to 1999 it is 0.754. The beta of QQQ on DIA is 0.98, so a dollar-for-dollar pair is very nearly beta neutral — which sounds close to riskless, and isn't.
The daily standard deviation of QQQ over that window is 1.24%. Hold the pair at equal notional and you are left with 0.96% a day, about 15.3% annualised: roughly 39% of the variance of a long Nasdaq position removed, and a position that still moves almost one percent a day left behind. The reason is that the two indices are not the only things in the book — the semiconductor and software baskets correlate at 0.62 with each other, your hedge never touched that, and this week that is where all the money was.
Two tickets, one bill
None of which touches the cost, and cost never shows up in a correlation coefficient. Take a $25,000 account with $25,000 of notional on each leg, $50,000 gross. CFD financing is usually a short rate plus a markup; the three-month T-bill was 4.088% on Thursday, so a two point markup gives 6.09%. Across $50,000 on two legs that is $3,044 a year — $8.34 every calendar day, weekends included, or 12.18% of account equity per year. Add margin at 5% per leg and $2,500 of the account is locked, 10% of equity, before a single tick of the spread goes your way.
And the spread does not pay you in the direction you would assume. Over twenty-session windows the median outcome for a long Dow / short Nasdaq pair is -0.50%, because across this sample the Nasdaq has generally out-earned the Dow. You are paying $8.34 a day to hold a position whose median outcome is negative.
Where a stop on the spread has to sit
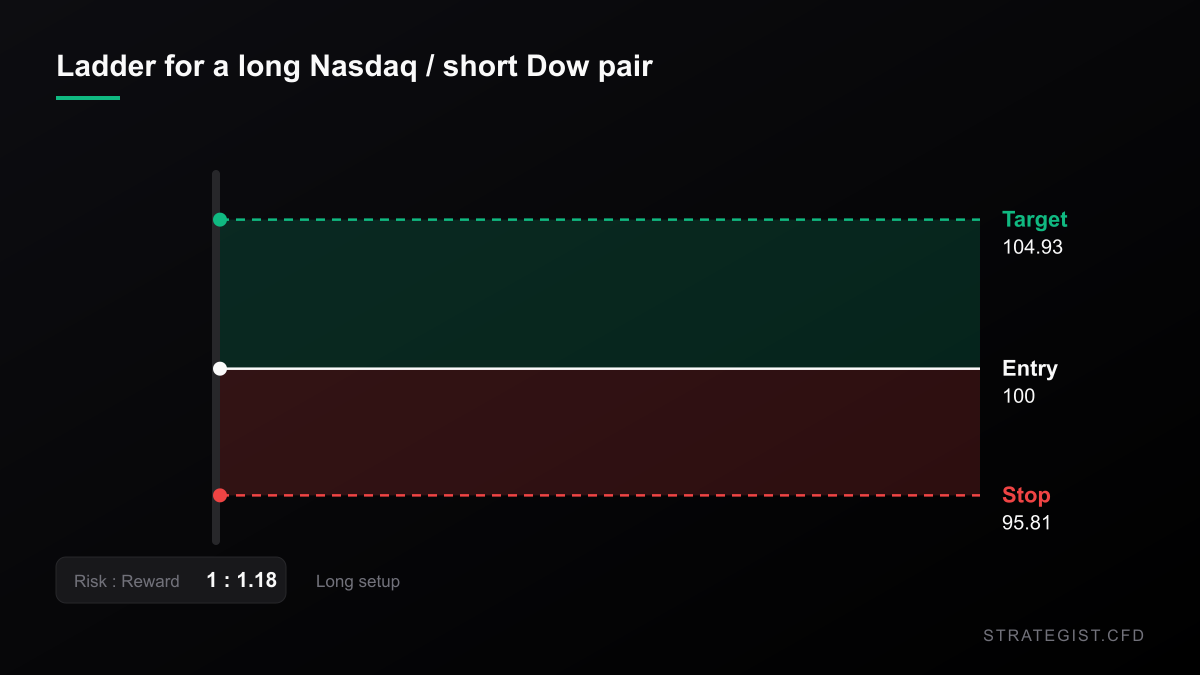
If you run the pair anyway, size it against what the spread does, not against what the index does. Across 20-session windows the pair's median outcome is -0.50%, with a tenth percentile of -4.93% and a ninetieth of +4.19% — so for the reverse position, long Nasdaq and short Dow, the tenth percentile is -4.19% and the ninetieth is +4.93%. The worst point reached inside a 20-day window has a median of -2.07%, a tenth percentile of -6.45% and a record of -31.68%. That record is not a 2008 artefact you can wave away; it is what a two-leg spread does when one leg gaps.
That gives a ladder: stop around 4.2% below the entry spread, target around 4.9% above it. On $25,000 of notional that is roughly $1,050 of risk against $1,230 of reward — a reward-to-risk of 1.18, on a position costing $8.34 a day while you wait for it to resolve.
Risk Analyzer
Quantify event-specific risks and calculate potential impact on your portfolio.
What I would actually do with this
Four things, in order of how much they matter.
- Stop treating the Nasdaq as one position. An index CFD is a weighted average of thirty-one names that on Thursday ranged from -5.5% to +6.3%. If your thesis is about semiconductors, a Nasdaq 100 ticket is a diluted way to express it.
- Widen the stop or cut the size before the next print. Rotation days take the share of names dipping 3% below the prior close from 3.2% to 19.4%, and 2026 has already produced twice the usual number of them.
- Price the hedge before you put it on. Long Dow, short Nasdaq removes about 39% of the variance of a long Nasdaq position and leaves 15.3% annualised volatility, two spreads, two margin charges and $8.34 a day on $50,000. It can be worth doing. It is not free.
- Don't trade the rotation as a signal. Forward medians after rotation days are indistinguishable from the unconditional ones. Putting the pair on is a valuation call, not a pattern.
How this is wrong
I would rather name the holes than bury them. First, I used QQQ, DIA and sector ETFs as proxies for the index CFDs you would actually trade. A CFD adds spread, financing and its own margin schedule on top. Every conclusion here survives that; the decimals don't.
Second, Thursday's figures are intraday, pulled at roughly 13:05 New York time with the session still open. The Dow's +424 could be +200 by the bell.
Third, the forward tests are medians conditional on one variable, with no view on why the rotation is happening. If the AI capital-spending story has genuinely broken, this is a regime change and a sample starting in 1999 is the wrong evidence base. The doubling of rotation-day frequency in 2026 is the only number here that hints at that, and fourteen events is too few to conclude anything from.
Fourth, correlation rises under stress. The 0.628 I quoted is a quiet-market reading; the full sample is 0.754, and the 2008 and 2020 observations inside it are why.
What I actually ran
Daily bars for QQQ, DIA, SPY, ten sector SPDRs and thirty-one Nasdaq constituents, pulled from Yahoo Finance on 15 October 2026. Statistics use closed sessions only: 1999-03-11 to 2026-10-14 for the index work (6,942 paired sessions), 2012-05-21 onward for the cross-section, the date from which all thirty-one names have a full history. A rotation day is DIA up at least 0.25% and QQQ down at least 0.25% on the same close. Forward returns are close to close, gross of costs and financing; baskets are equal weighted. Thursday's figures are a 13:05 New York snapshot and enter no statistic.
Charts and analysis on this site are for research only and are not investment advice.
For the mechanics behind the sizing arithmetic above, start with
Why Position Sizing Matters More Than Entry Signals
Entry signals decide where you trade; position sizing decides whether you survive. Why capital allocation dominates entry precision in leveraged CFD markets, and how to build a sizing rule you can actually follow.
Nasdaq Up 3%, Dow Down 3.5%: What a Split Month Does to Your Stop
Core PCE printed 3.0% against 3.3% expected, and the tape answered unevenly: Nasdaq 100 up, Dow down. September's gap between the two sits in the top 7% of months since 1992, and it changes the stop distance you should be using.
More in News
 News2026-10-31
The Nasdaq Just Entered Its Third Correction of 2026. The Closing Price Disagrees.
Three ways to measure Friday's drawdown give -9.09%, -10.03% and -10.42%. Which one your broker uses decides whether you survived it.
 News2026-10-31
The S&P Lost 1.82% on Friday. 64% of It Was Priced Before the Bell.
Semis fell 6.98%, the S&P 1.82%, and most of the move was an overnight gap. What the split between the gap and the session says about stop placement, fills and the one trade Friday actually set up.
 News2026-10-17
Oil Hit $110 and the Nasdaq Had Its Worst Week in 18 Months. That Pair Has No Precedent.
Brent closed at $109.86 on Friday and WTI gained 10.41% on the week. The Nasdaq 100 fell 5.49% over the same five sessions. In 1,084 weeks of data that pairing has never happened — here is what it means for a leveraged book.