Everyone Expects a Fed Hold on 28 October. The Range Doesn't.
Two weeks, one date, no signal
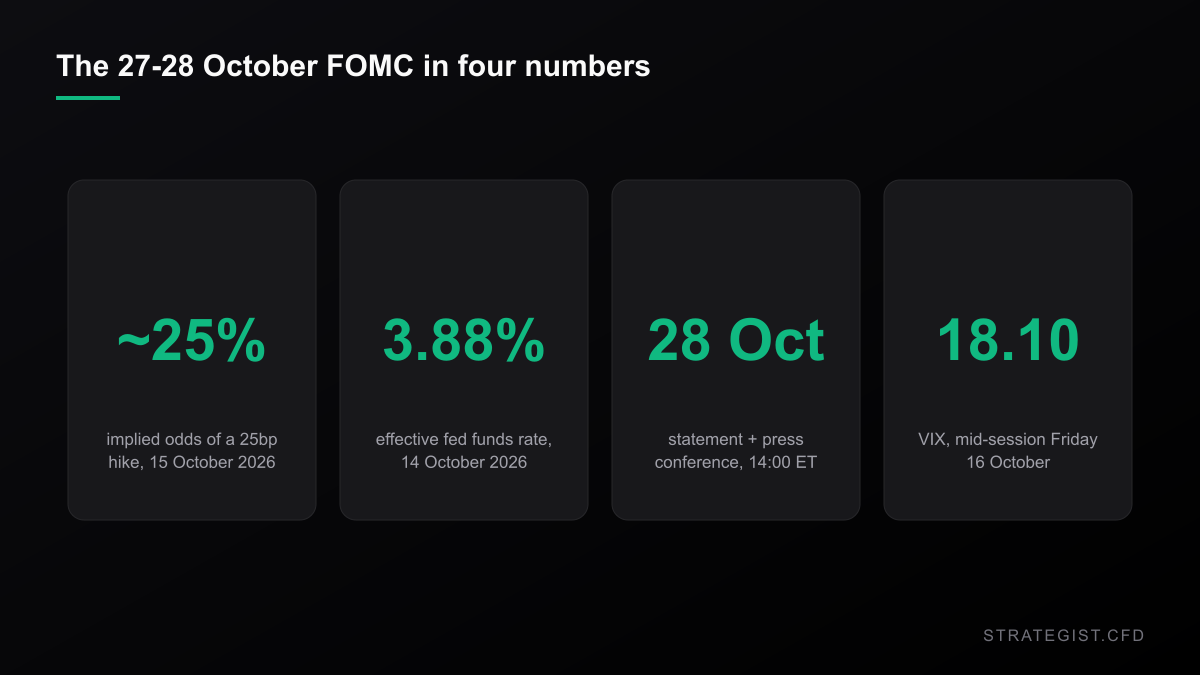
Fed chair Kevin Warsh spent Thursday at a conference and declined to say anything useful about the 27-28 October meeting. Reuters, Bloomberg and the FT all ran the same story: no hint, no pushback. What traders did with that silence was to raise the odds of a hold. TradingView had October hike odds retreating below 30% on Thursday, and one desk put the implied chance of a 25bp move at 24.9% the same day.
So the setup is a decision at 2:00 PM ET on Wednesday 28 October, an effective fed funds rate of 3.88% as of 14 October, and a market that thinks it already knows the answer. Around mid-session on Friday the S&P 500 sat at 7,674.45, down 0.90% on the day, the VIX at 18.10, and QQQ off 1.94%.
Here is the part that matters if you are carrying a leveraged position into the announcement. "Everyone expects a hold" is not the same sentence as "nothing will happen to your stop."
What no change actually means, counted
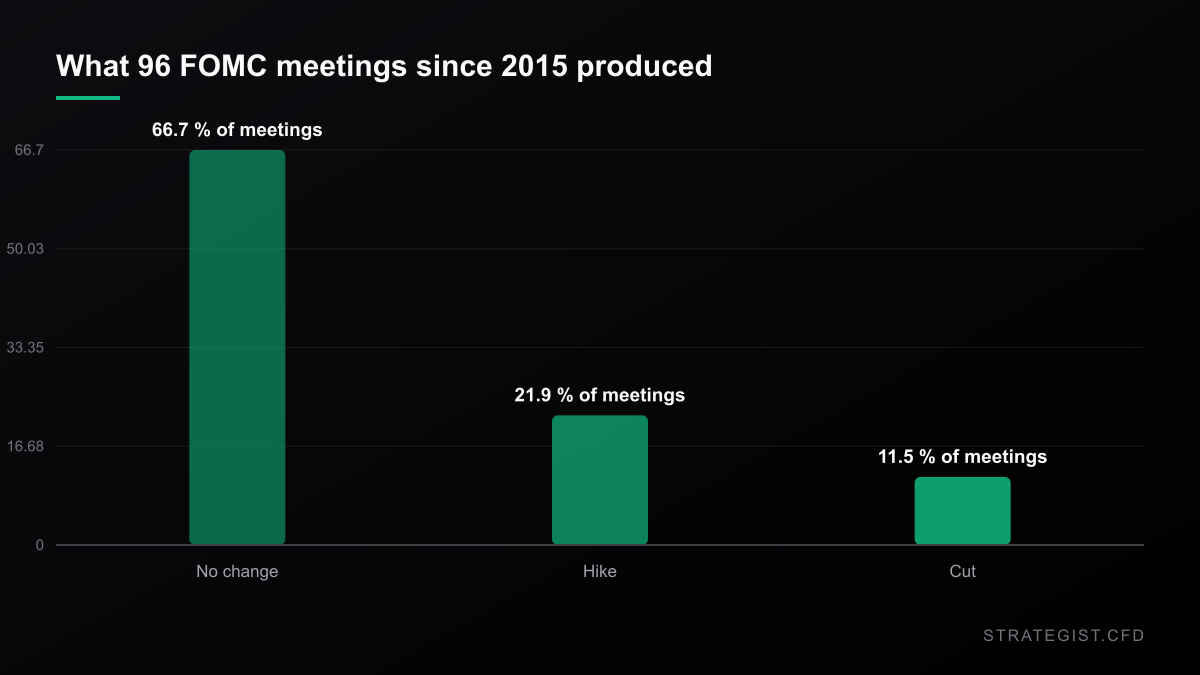
I pulled the date of every FOMC statement since 2015 out of the Federal Reserve's press-release index - 96 of them - and classified each by what the effective fed funds rate did over the next five sessions: 15bp or more is a change, anything less is a hold.
64 of the 96 meetings, 66.7%, ended with no change. 21 were hikes, 11 were cuts. If you want one number to set against the market's roughly 25%, that is it: about one meeting in five has produced a hike since 2015.
Two things complicate it. The Fed has been busier lately - since 2022, 18 of 38 meetings moved - and 2026 has been quiet: six meetings, one change, the 25bp hike on 16 September. Sitting still is the default, and it is the default currently running.
The open doesn't move. The afternoon does.
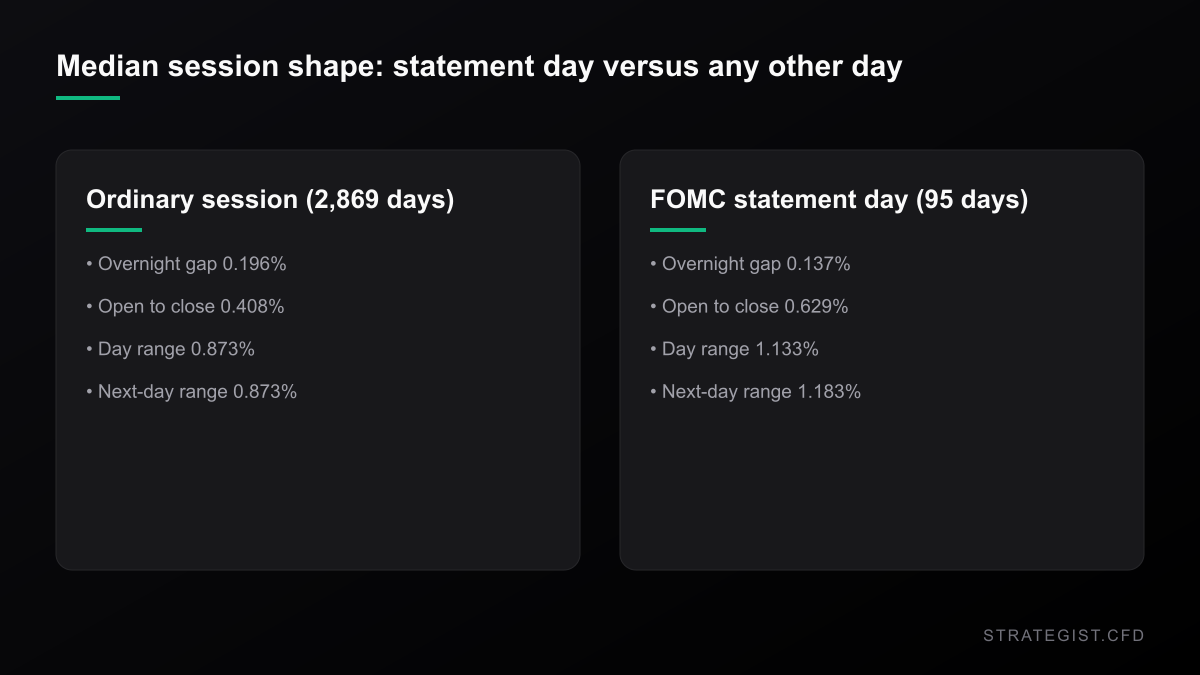
Daily bars cannot see a 2:00 PM announcement, but they can see its shadow. Across the 95 statement days since 2015 with full market data, against 2,869 other trading days:
- Overnight gap: 0.137% on a statement day versus 0.196% on any other day. The open is quieter than usual, by roughly a third.
- Open to close: 0.629% versus 0.408% - 1.54x an ordinary session.
- High-low range: 1.133% versus 0.873% - 1.30x.
- Close to close: 0.605% versus 0.488% - only 1.24x.
That is the whole story in four lines. Nobody positions ahead of the statement; everybody waits for it. Then the range opens up while the close barely moves more than normal. The distance between the open and the close is where the announcement lives, and it runs half again as large as on an ordinary day. Which means a stop placed anywhere near the morning's extreme is not really a stop.
One hour holds most of the day
This part I can only check on the most recent meetings, because 5-minute history is short. On 16 September 2026 - the meeting that hiked - the S&P 500's range for the session was 119 points. The single hour from 14:00 to 15:00 ET contained 61.3% of it, and everything after 14:00 contained 96.6%. Across the last 60 sessions the median share of the daily range inside that one hour is 26.3%, and the median share after 14:00 is 39.6%. The 29 July statement day is the other one inside that window: 48.2%, seventh highest of the 60.
Two observations is not a study, and I am not going to pretend otherwise. But both statement days in the sample sit inside the top eight of sixty sessions for that hour, which is not what random looks like. The practical point for a CFD book: the risk of decision day is not spread over six and a half hours, it is concentrated into roughly sixty minutes, and the spread your broker quotes during that hour is not the spread you were quoted at 11:00.
Hold days widen the middle, not the tail
Split the 95 statement days by what the Fed actually did and the interesting part shows up. On the 64 no-change days the median range was 1.098%, about 26% wider than a normal session. The median close-to-close move was 0.531%, barely above the 0.488% control, and 50.0% of those days finished within 0.5% of the previous close - against 50.5% for ordinary days.
So on a hold day the range gets wider and the destination stays the same. That is churn. 56.3% of hold days had a range of at least 1%, versus 41.3% of control days. But the tail is not there: only 20.3% of hold days ranged 1.5% or more, against 19.4% of ordinary days. Statistically the same.
The tail belongs entirely to the surprises. On the 31 days the Fed actually moved, 48.4% ranged 1.5% or more and the median close-to-close move was 0.743%. What you are holding into 28 October is a two-thirds shot at a modestly wider, directionless day and a one-in-three shot at a genuinely large one.
The day after is as wide as the day itself
The announcement day gets the attention; the next session does just as much work. Median range on the day after a statement: 1.183% versus 0.873% for control, 1.35x - slightly wider than the statement day's own 1.30x. Median close-to-close: 0.642% versus 0.484%, or 1.33x. Across both sessions together, the index travels a median 0.944% from the pre-meeting close, against 0.727% for a random two-day window.
Direction will not rescue you. 53.7% of statement days were followed by a next session in the same direction, against 48.2% for control days. Close enough to a coin flip that "I will just hold through it" is not a view - it is a coin toss with a stop attached to it.
Where your stop has to sit
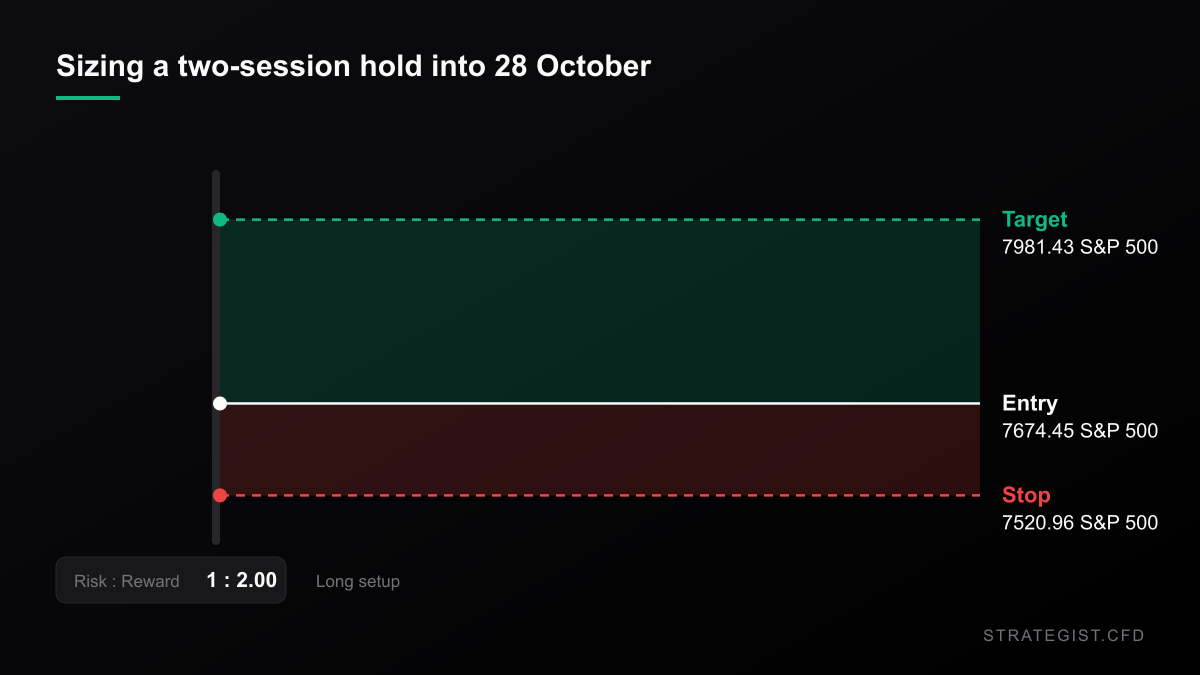
Now the part with a number you can use. Take a long entered at the previous session's close and held through the statement and the next session - 95 such windows, against 2,869 two-session control windows. How often does the low reach x% below entry?
- 1% stop: hit 40.0% of the time on a statement window, 31.8% on a control window.
- 2% stop: 18.9% versus 12.5%.
- 3% stop: 8.4% versus 4.8%.
- 4% stop: 4.2% versus 2.1%.
The median worst excursion against a long over those two sessions was 0.71% on a statement window versus 0.56% normally, and the 90th percentile was 2.76% versus 2.21%.
Notice where the risk is not. On the statement day alone, a 1% stop was hit 21.1% of the time against 20.0% for control - almost no difference at all. The event is not the day. It is the day plus the morning after.
On a $25,000 account risking 1%, which is $250, a 1% stop buys $25,000 of notional - exactly 1x equity. A 2% stop buys $12,500, or 0.50x. A 3% stop buys $8,333, or 0.33x. That is the real cost of the meeting: not the spread and not the financing, but the fact that a stop tight enough to feel safe gets taken out four times in ten.
What the carry costs: almost nothing
This is where I expected to tell you that overnight financing was the bill, and it is not. The 13-week Treasury bill (^IRX) was 4.07% on Friday. Add a typical 2% broker markup and a long index CFD costs roughly 6.07% a year. Carrying 1x notional through the two nights around the meeting costs $8.32 on a $25,000 account - 3.3% of one R. At 0.50x it is $4.16.
So for a two-day event the financing is a rounding error, and every decision collapses into one variable: how far your stop has to sit, which decides how much notional you are allowed to run. Run the arithmetic on your own numbers with the
Risk Analyzer
Quantify event-specific risks and calculate potential impact on your portfolio.
Where this view is wrong
Three honest problems. First, 95 events is a small sample, and the hold-versus-change split inside it is 64 to 31; the hold-day medians rest on that, not on thousands of observations.
Second, and more serious: I have no history of what the market expected at each meeting, only what happened. A hold everyone saw coming and a hold that genuinely surprised people are pooled together in those numbers. That almost certainly makes the hold-day figures look more eventful than a truly priced-in hold would be - or less; daily bars cannot separate the two. "Priced in" is the one variable in this piece I could not measure, and it is the one the whole article is nominally about.
Third, the volatility crush I half expected to find did not really materialise. Median VIX on the day before a statement was 16.42, and two days later the median change was -1.98%, with 57.9% of observations lower. That is a mild drift, not the collapse that options folklore promises: 42% of the time volatility was higher after the meeting than before it.
And the obvious one - if Warsh does move on 28 October, every hold-day number above is irrelevant and you are in the 48.4% tail instead.
Method: FOMC statement dates from the Federal Reserve's press-release index; hold-versus-change from the FRED daily effective funds rate (DFF), 15bp over five sessions; prices from Yahoo daily bars for ^GSPC, QQQ, ^VIX and ^IRX, 2015-01-01 to 2026-10-16, plus 5-minute bars for the last 60 sessions. All statistics use closed bars only, except Friday 16 October, which is mid-session.
What to do on 28 October
- Decide before Wednesday, not during the press conference. The hour that matters starts at 14:00 ET and held 61.3% of the last statement day's range.
- If you hold through, size for a stop that survives two sessions, not one. A 1% stop is taken out 40% of the time; 2% cuts that to 18.9% and halves your notional.
Risk Analyzer
Quantify event-specific risks and calculate potential impact on your portfolio.
Everything else landing that week is on the
Economic Calendar
Track high-impact global events with real-time updates and historical volatility analysis.
Bank Earnings Tuesday, CPI Wednesday: What That Does to Your Stop
JPMorgan, Wells Fargo, Citi and Goldman report before Tuesday's open; September CPI lands Wednesday at 8:30 ET. The index doesn't care. A US bank single name does. Here is what the overnight gap does to a stop placed on Friday's close.
Why Position Sizing Matters More Than Entry Signals
Entry signals decide where you trade; position sizing decides whether you survive. Why capital allocation dominates entry precision in leveraged CFD markets, and how to build a sizing rule you can actually follow.
Charts and analysis on this site are for research only and are not investment advice.
More in News
 News2026-10-31
The Nasdaq Just Entered Its Third Correction of 2026. The Closing Price Disagrees.
Three ways to measure Friday's drawdown give -9.09%, -10.03% and -10.42%. Which one your broker uses decides whether you survived it.
 News2026-10-31
The S&P Lost 1.82% on Friday. 64% of It Was Priced Before the Bell.
Semis fell 6.98%, the S&P 1.82%, and most of the move was an overnight gap. What the split between the gap and the session says about stop placement, fills and the one trade Friday actually set up.
 News2026-10-17
Oil Hit $110 and the Nasdaq Had Its Worst Week in 18 Months. That Pair Has No Precedent.
Brent closed at $109.86 on Friday and WTI gained 10.41% on the week. The Nasdaq 100 fell 5.49% over the same five sessions. In 1,084 weeks of data that pairing has never happened — here is what it means for a leveraged book.