Bank Earnings Tuesday, CPI Wednesday: What That Does to Your Stop
Two dates, thirty hours apart
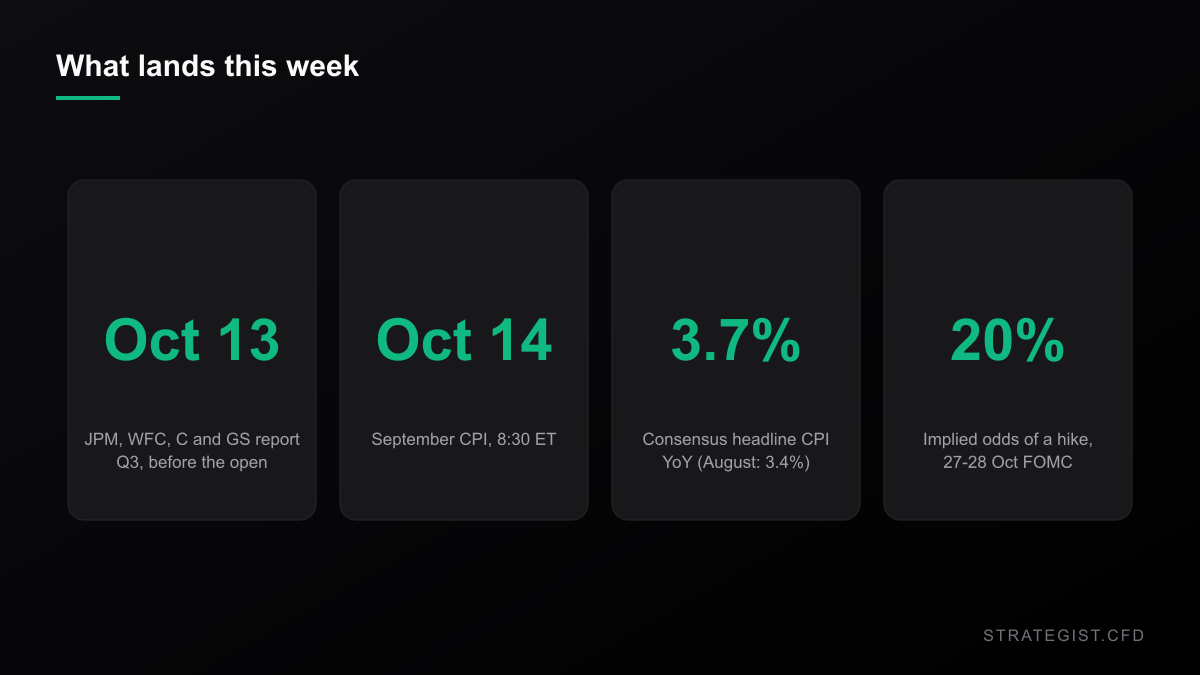
Friday's close left the S&P 500 at 7,811.54, the VIX at 14.84 and JPMorgan at $332.99. Nothing in that tape looks like a setup. Then the calendar takes over: JPMorgan, Wells Fargo, Citigroup and Goldman Sachs report third-quarter numbers before Tuesday's open, and September CPI lands at 8:30 ET on Wednesday. Two separate shocks, roughly thirty hours apart, with one weekend and one ordinary session in between.
Consensus wants headline CPI at 3.7 percent year over year, up from August's 3.4 percent, mostly on gasoline. Core is seen unchanged at 2.4 percent. The Cleveland Fed's nowcast puts headline at 3.60 percent with a 0.53 percent monthly gain. Futures price roughly a 20 percent chance of a hike at the 27-28 October FOMC and about 81 percent odds of at least one by December. It all sits on a Fed that is already tightening - it hiked 25bp on 16 September.
None of that is a trade. The trade question is narrower: you hold something into Tuesday, and into Wednesday, and your stop sits where you put it on Friday afternoon. What does history say happens to that stop?
The index never notices
I pulled daily bars for JPM, the XLF sector ETF and the S&P 500, then split every session since 2015 into two buckets: the stretch around the middle of January, April, July and October - calendar days 9 to 18, when big banks report and CPI is released - and everything else. That gave 323 window days against 2,637 others. It's a calendar proxy, not a list of actual earnings dates; more on that below.
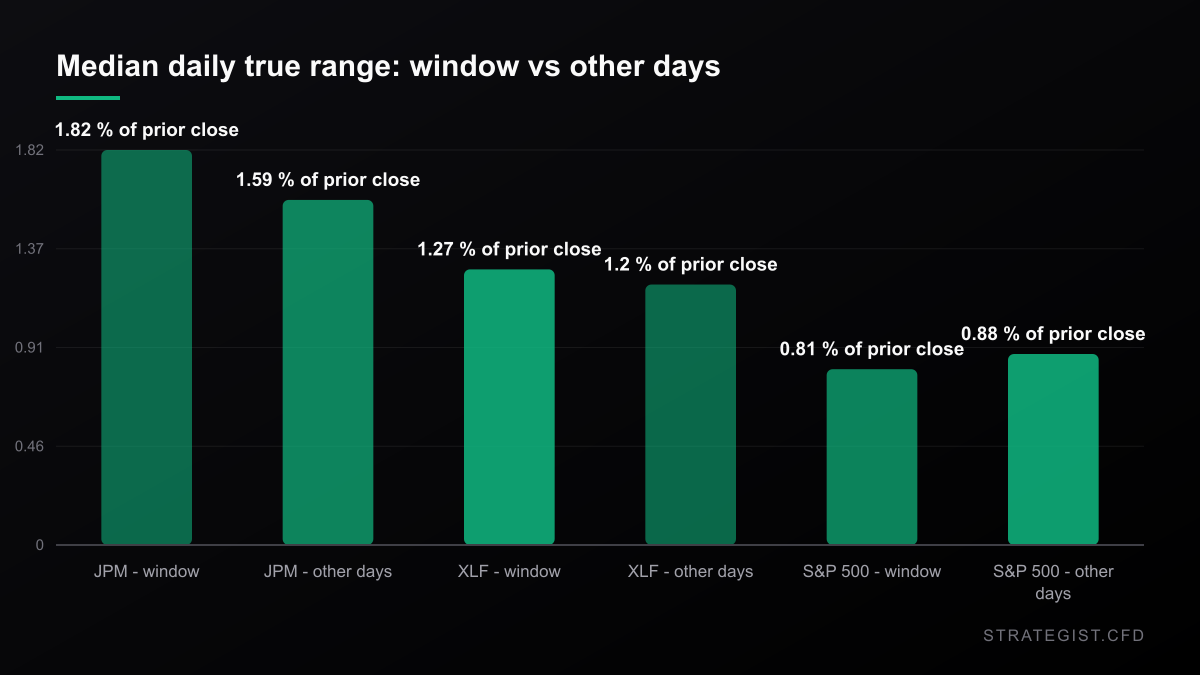
For the index the answer is: nothing. Median true range inside the window is 0.81 percent, outside it is 0.88 percent. The window is actually quieter. Median absolute close-to-close move runs 0.46 percent against 0.50 percent. If your exposure is an SPX or US30 CFD, the phrase "big earnings week" describes a newsroom, not a risk profile.
Which makes sense. Four banks are a few percent of the index, and their idiosyncratic gaps get averaged out before they reach your P&L. Whatever premium you pay for holding through this week is a single-name premium.
The range gets wider, the close doesn't
JPM is a different story. Median true range inside the window is 1.82 percent against 1.59 percent outside - about 14 percent wider. The tail widens too: the 90th percentile goes from 2.99 percent to 3.41 percent.
But the close barely moves. Median absolute close-to-close change is 0.82 percent in the window versus 0.79 percent outside. Essentially the same number. The day travels further and ends up roughly where it would have ended up anyway.
That combination is the expensive one. Extra intraday range with no extra directional payoff is exactly the environment where a stop placed at the prior close gets touched by noise rather than by information. The stock does a two-and-a-bit percent round trip, closes 0.8 percent from where it started, and you're flat at the worst print of the day.
Friday's close to Wednesday's close
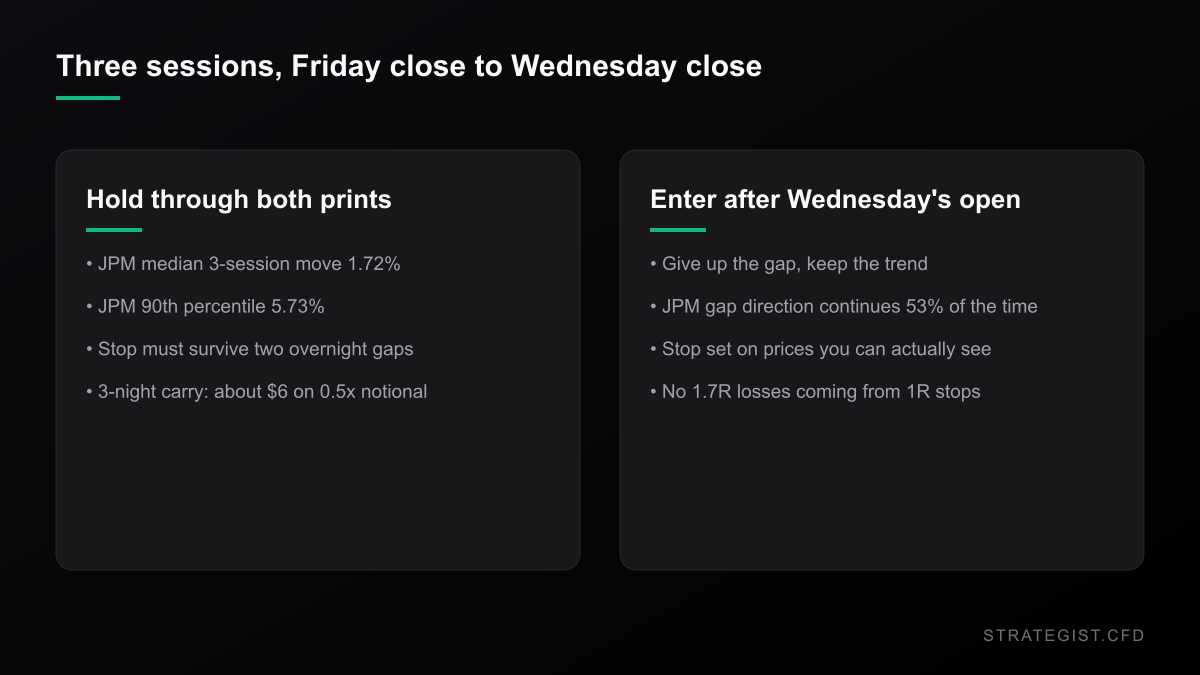
Now hold the whole thing. Friday's close to Wednesday's close is three sessions - Monday the 12th, Tuesday the 13th, Wednesday the 14th - and it contains both catalysts. For JPM, the median absolute three-session move inside the window is 1.72 percent versus 1.43 percent for clean three-session spans. The 90th percentile is 5.73 percent versus 3.99 percent. The middle of the distribution is about 20 percent wider; the tail is about 44 percent wider.
XLF sits in between, as you'd expect: 1.36 percent versus 1.13 percent, a 20 percent wider median with the tail unchanged. The sector ETF eats the average of the single names and dilutes away the individual blow-ups. The index, again, shows nothing - 0.85 percent versus 0.90 percent.
Your stop is a closing price and the news is a pre-open number
Here is the mechanic that actually bites. Bank earnings come out before the open. CPI comes out at 8:30 ET, ninety minutes before the opening bell. Neither one happens while you're watching candles. Both land in the overnight gap, and your stop - placed at Friday's close - has to survive a price it never saw.
For JPM since 2015, the median overnight gap is 0.44 percent and the median intraday move is 0.66 percent. On a variance basis the gap is roughly 44 percent of the daily move. Inside the window the median gap goes from 0.43 percent to 0.53 percent.
What matters is the adverse tail. Holding a JPM long overnight, the open alone gaps through a 1 percent stop on 8.9 percent of all days, and on 10.5 percent of window days. Through a 2 percent stop: 2.7 percent of days, 4.6 percent in the window. Through a 3 percent stop: 0.9 percent of days, 1.9 percent in the window. And when it does gap through, the average adverse gap is 1.94 percent against a 1 percent stop, or 3.34 percent against a 2 percent stop - roughly 1.7 to 1.9 times the loss you budgeted.
Run that as a drag. Per hundred overnight holds, a 1 percent stop costs about 8.4R in gap slippage. A 2 percent stop costs about 1.8R. A 3 percent stop, 0.7R. The stop distance is doing more work here than the entry is.
What one percent of risk actually buys
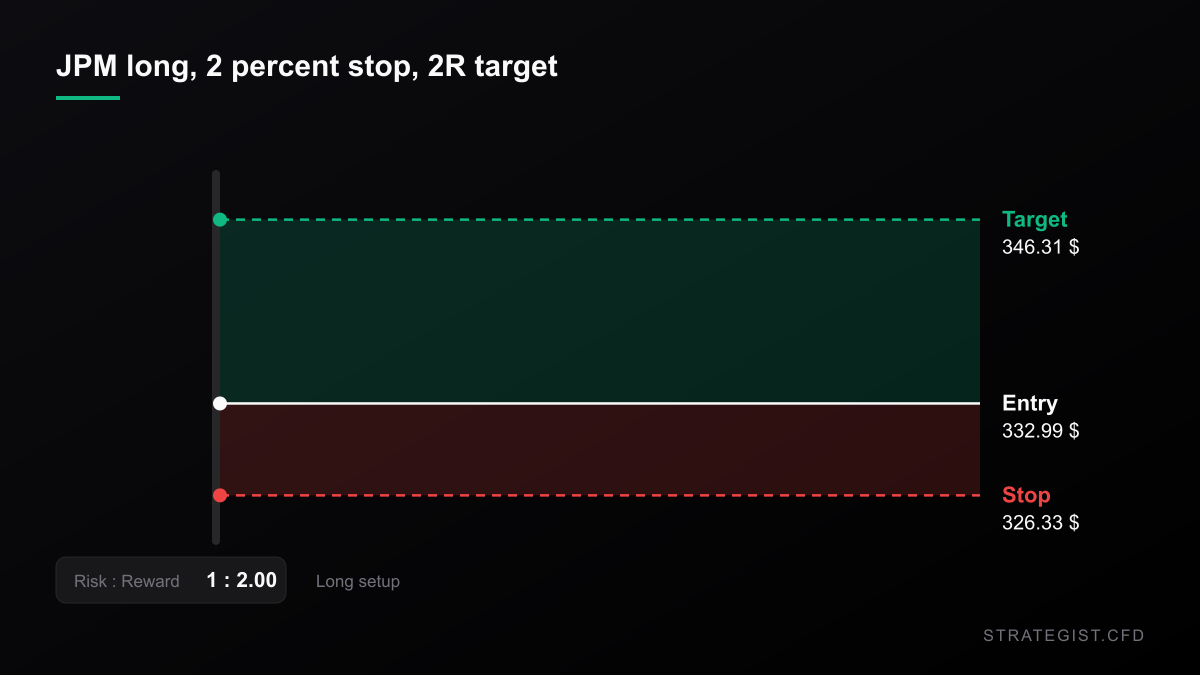
On a $25,000 account, 1 percent of risk is $250. With a 2 percent stop on JPM at $332.99, that's a stop at $326.33 and $12,500 of notional - half the account. With a 1 percent stop you'd sit at $329.66 and $25,000 of notional, one times the account, and you'd pay three to four times the gap slippage for the privilege.
The instinct is to take the tighter stop because it lets you hold more size. For an event week the numbers say the opposite: the tight stop is the one that turns a 1R loss into a 1.9R loss, about one time in eleven. Wider stop, smaller size, same dollar risk, far fewer surprises.
The carry bill is a rounding error this time
Worth saying out loud because it cuts against what I've written before about holding costs. Three nights of financing on $12,500 of notional, at the 13-week bill's 4.06 percent plus a 2 percent broker markup, comes to $6.22. That's 0.025R. Over a three-night hold, carry is noise.
That isn't because CFDs are cheap. It's because the exposure is short. Carry scales with time and with notional; gap risk scales with the event. When the holding period is measured in days, your financing line is a footnote and your slippage line is the whole story. Save the carry arithmetic for longer holds.
Fade it or chase it
So the gap happens. Do you trade with it? For JPM, days where the open gaps more than 1.5 percent - 277 of them since 2015, about 9 percent of sessions - see the intraday move continue in the gap's direction 53.1 percent of the time. Average continuation is 1.41 percent; average reversal is 1.66 percent. A coin flip, and slightly asymmetric against you if you chase.
The index behaves differently: after a gap bigger than 1.5 percent, the S&P continued 66 percent of the time on 53 observations. Same caveat as every other small-sample figure here - 53 events across eleven years isn't many, and 2020 is doing a fair share of the work.
How this is wrong
Several ways. First, the window is defined by calendar dates, not by actual earnings and CPI dates. Bank of America reports later than the other four, and CPI has landed anywhere from the 10th to the 15th in recent years. Misclassification dilutes the effect, so these numbers probably understate what a true earnings-day sample would show - but it also means I can't separate the earnings shock from the inflation shock using daily bars.
Second, 323 window days since 2015 isn't a big sample and they aren't independent; every April window shares the macro regime of its year. The 4.6 percent window rate at a 2 percent stop is about fifteen events. Third, the gap statistics start in 2015 because earlier index opening prints are unusable - the full-history sample shows a median overnight gap of 0.008 percent, which is not a real number.
Fourth, the conditional averages are tail-driven. "Average adverse gap of 3.34 percent" is a mean over a distribution that includes single days worse than 5 percent; the median adverse gap once you're through a 2 percent stop is lower. And none of this accounts for the bid-ask spread at the open, which on a CFD can run several times normal in the first minutes after a print.
What to do with it
- Find out which instrument you're actually trading. If it's an index CFD, none of the above applies - the window is quieter than average. If it's JPM, BAC or C, all of it applies.
- Decide before Monday whether you're holding through both prints or neither. Doing one and improvising the other is how people end up sized for a normal Tuesday on an earnings Tuesday.
- If you're holding, price the stop where the gap can take you, not where the chart says support is. Three percent on a bank single name through this week is a different animal from one percent.
- If you want the information without the gap, re-enter after Wednesday's first hour. You'll give up part of the move and you'll stop paying 1.7R for 1R losses.
- Check your broker's overnight financing rate before you size, but don't let it drive a three-night decision. It's six dollars.
Risk Analyzer
Quantify event-specific risks and calculate potential impact on your portfolio.
Economic Calendar
Track high-impact global events with real-time updates and historical volatility analysis.
Nasdaq Up 3%, Dow Down 3.5%: What a Split Month Does to Your Stop
Core PCE printed 3.0% against 3.3% expected, and the tape answered unevenly: Nasdaq 100 up, Dow down. September's gap between the two sits in the top 7% of months since 1992, and it changes the stop distance you should be using.
Why Position Sizing Matters More Than Entry Signals
Entry signals decide where you trade; position sizing decides whether you survive. Why capital allocation dominates entry precision in leveraged CFD markets, and how to build a sizing rule you can actually follow.
Method note. Daily OHLC bars from Yahoo Finance for JPM (2 January 1990 to 9 October 2026), XLF (from 22 December 1998) and ^GSPC / ^VIX (from 2 January 1990). All gap statistics use 2015 onward because earlier index opening prints are unreliable. "Window" is a mechanical filter: sessions whose calendar date falls on days 9 to 18 of January, April, July or October - 323 sessions since 2015 versus 2,637 others. Gap is open divided by prior close; intraday is close divided by open; true range is high minus low over prior close. Conditional gap figures condition on the adverse direction only. Financing uses the 13-week Treasury bill (^IRX, 4.057 percent on 9 October 2026) plus a 2 percent broker markup. Consensus CPI figures are from Admirals' 8 October preview and the Cleveland Fed nowcast of 7 October; the release schedule is from BLS. This is a calendar-seasonality study, not a backtest of any trading strategy, and it makes no claim about any system's returns.
Charts and analysis on this site are for research only and are not investment advice.
More in News
 News2026-10-31
The Nasdaq Just Entered Its Third Correction of 2026. The Closing Price Disagrees.
Three ways to measure Friday's drawdown give -9.09%, -10.03% and -10.42%. Which one your broker uses decides whether you survived it.
 News2026-10-31
The S&P Lost 1.82% on Friday. 64% of It Was Priced Before the Bell.
Semis fell 6.98%, the S&P 1.82%, and most of the move was an overnight gap. What the split between the gap and the session says about stop placement, fills and the one trade Friday actually set up.
 News2026-10-17
Oil Hit $110 and the Nasdaq Had Its Worst Week in 18 Months. That Pair Has No Precedent.
Brent closed at $109.86 on Friday and WTI gained 10.41% on the week. The Nasdaq 100 fell 5.49% over the same five sessions. In 1,084 weeks of data that pairing has never happened — here is what it means for a leveraged book.