The S&P Fell 1.06%. Thirteen of Thirty Mega Caps Went Up.
Wednesday's number, and what it did to the tape
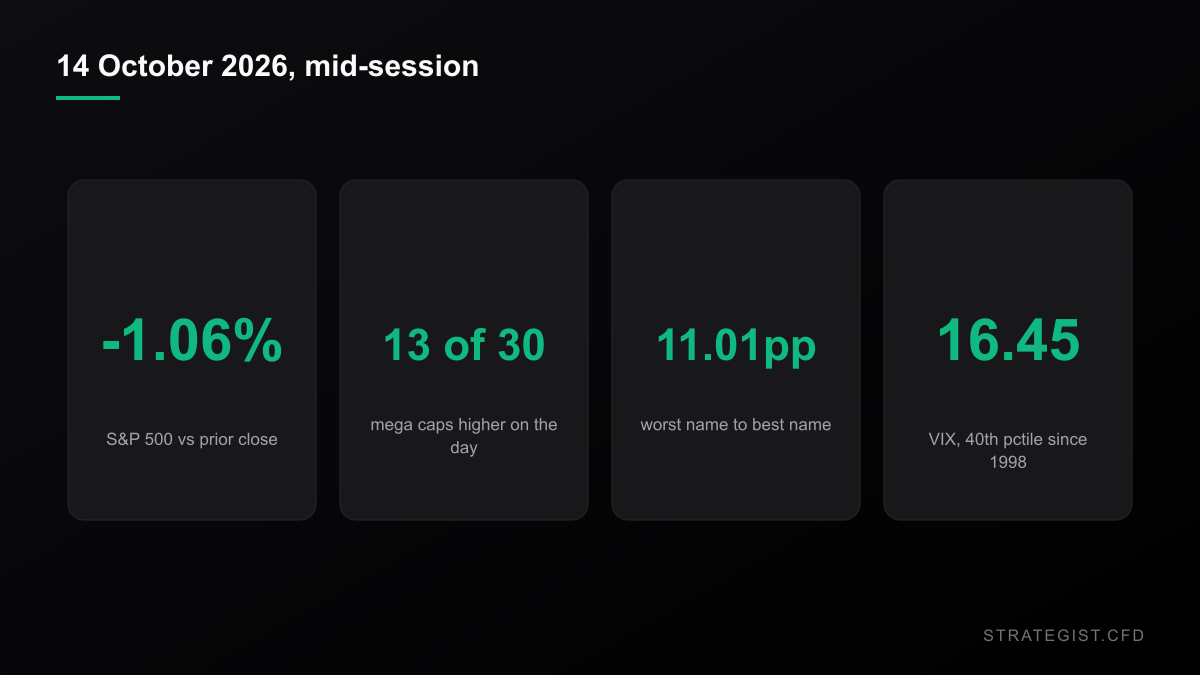
September CPI printed at 3.7% year over year, above what forecasters had pencilled in, with core at 2.6% and gasoline up 9.1% on the month — the first acceleration in four months, by the accounts carried on CNBC, Reuters and the WSJ. Within the hour the repricing was everywhere: the ten-year yield back at 5.24%, rate-hike bets jumping, bitcoin under $82,000, and a hike at the October meeting described as back on the table.
By mid-afternoon in New York the S&P 500 was down 1.06% at 7,722.76, the VIX had gone from 15.27 to 16.45, and small caps were taking it worse — IWM off 1.90%. Gold was down roughly 2% and silver roughly 6%.
Then look at the parts. Of thirty of the largest US listed companies, thirteen were higher on the day. Merck +3.75%, UnitedHealth +2.83%, Walmart +2.38%, Chevron +2.00%. At the other end: Oracle −7.26%, Bank of America −5.55%, AMD −5.34%, Intel −3.64%, Meta −3.33%. Worst to best is 11.01 percentage points of spread on a day the index moved one.
That spread is the story, not the print. A number that moves the index by one percent is an ordinary session if you trade the index. It is not an ordinary session if you hold the parts.
The index did exactly what it was priced to do
A VIX of 16.45 implies a one-day move of 16.45 ÷ √252 = 1.04%. The index delivered 1.06%. Nothing about the index was unusual, and 16.45 is only the 40th percentile of every VIX close since 1998. On days when the S&P falls at least 1%, the median VIX is 24.63 — Wednesday's reading sits in the bottom tenth of those. The options market slept through the whole thing.
That is the trap. "The market fell one percent" is the one number on the screen that behaved normally.
What a one percent day does to thirty names
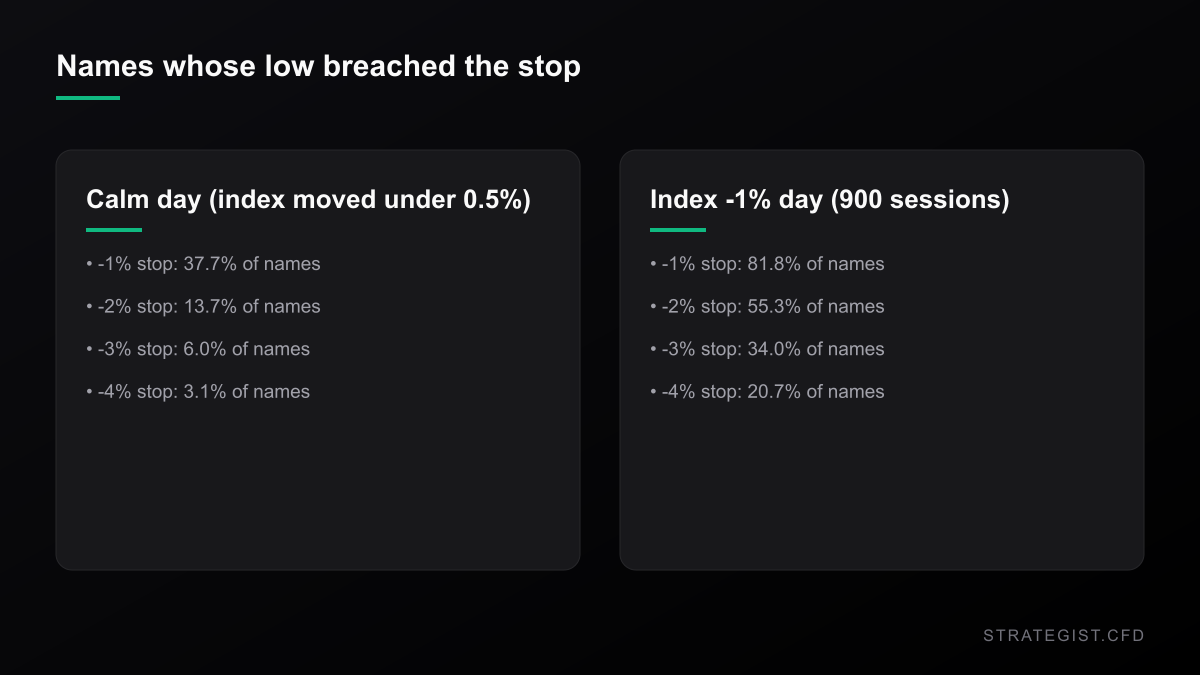
I pulled daily bars for thirty of the largest US stocks back to January 2000: 6,734 completed sessions, 900 of which closed the index down 1% or more, and 3,186 in which the index moved less than half a percent either way. Then I measured the parts rather than the whole.
On a calm day the median name moves 0.63% in absolute terms. On an index −1% day it moves 1.63%. That is 2.6x and on its own it isn't very interesting — of course a bigger index day means bigger name days. The tail is what matters. The share of names whose intraday low travels more than 3% below the previous close goes from 6.0% on a calm day to 34.0% on a shock day. The median move scales by 2.6; the number of names that travel far enough to take out a 3% stop scales by 5.7.
And the index is not the reason. Regressing each name's daily return on the index return, the index explains 19.2% of the cross-sectional variance on shock days and 2.6% on calm days; beta is about 0.99 either way. So even on the day everyone files under risk-off, more than four fifths of what happens to an individual position is not the index.
Correlation Matrix
Analyze the statistical relationship between different assets to avoid over-exposure.
Two weeks ago we ran the upside version of this and found that dispersion predicts size, not direction —
Nasdaq Up 3%, Dow Down 3.5%: What a Split Month Does to Your Stop
Core PCE printed 3.0% against 3.3% expected, and the tape answered unevenly: Nasdaq 100 up, Dow down. September's gap between the two sits in the top 7% of months since 1992, and it changes the stop distance you should be using.
Closes understate it by half
Every breach figure here uses intraday lows, which is what a stop actually experiences. Run the same count on closing prices and the picture softens a lot: 23.0% of names finished more than 3% below the prior close on a shock day, against 34.0% that traded there at some point during it. Anyone calibrating stop distance from a close-to-close distribution is underestimating how often they get stopped by roughly a half.
The day is the risk factor, not the name
The breach rate is not stable across shock days. At a 3% stop, the median shock day takes out 30% of the basket, the worst tenth take out 66.7%, and the mildest tenth take out 10%. Comparing the day-to-day variance of that breach rate with what independent names would produce, it runs seven to ten times higher. In plain terms: which names you own matters much less than which day it is. Stock picking does not diversify a calendar event.
Where the stop has to sit
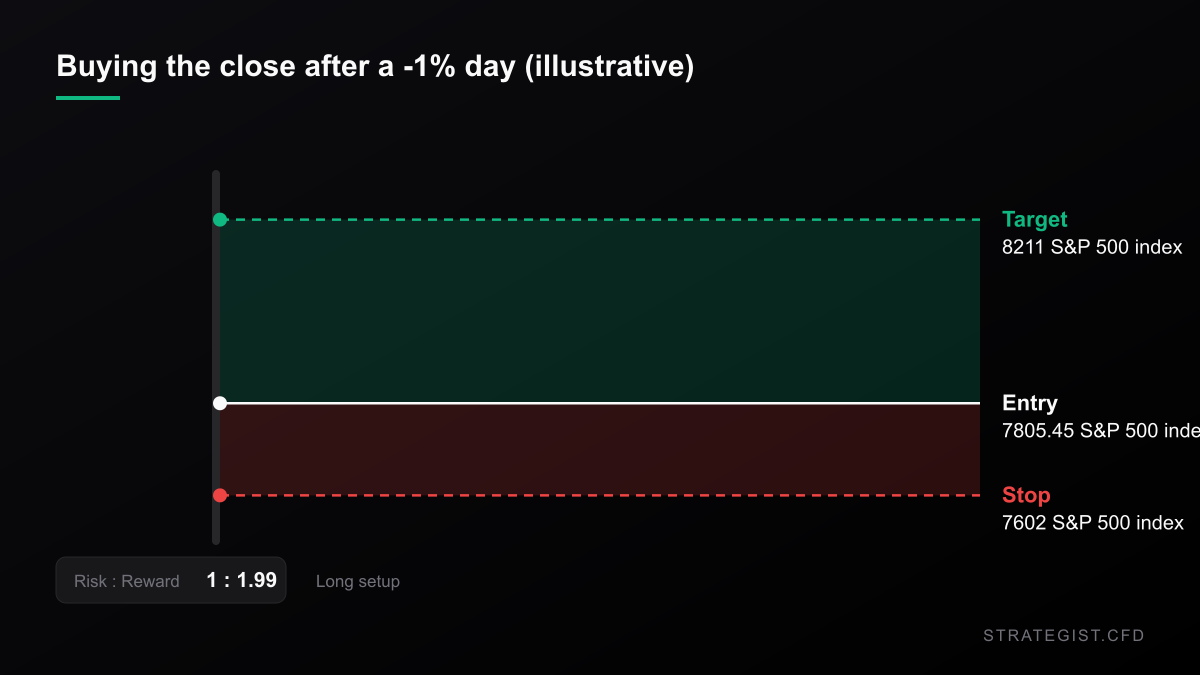
Say you buy the close of a −1% day — Tuesday's 7,805.45, for instance. Across all 900 such sessions since 2000, the median worst low after that entry is −1.98% within five sessions, −2.62% within ten, and −3.57% within twenty. A 3% stop on the index gets touched within ten sessions 41.8% of the time, against 28.0% unconditionally.
That is the number to argue with, not the entry. A stop placed inside the median ten-session excursion isn't risk management, it is a donation to whoever is on the other side.
What the wider stop costs you
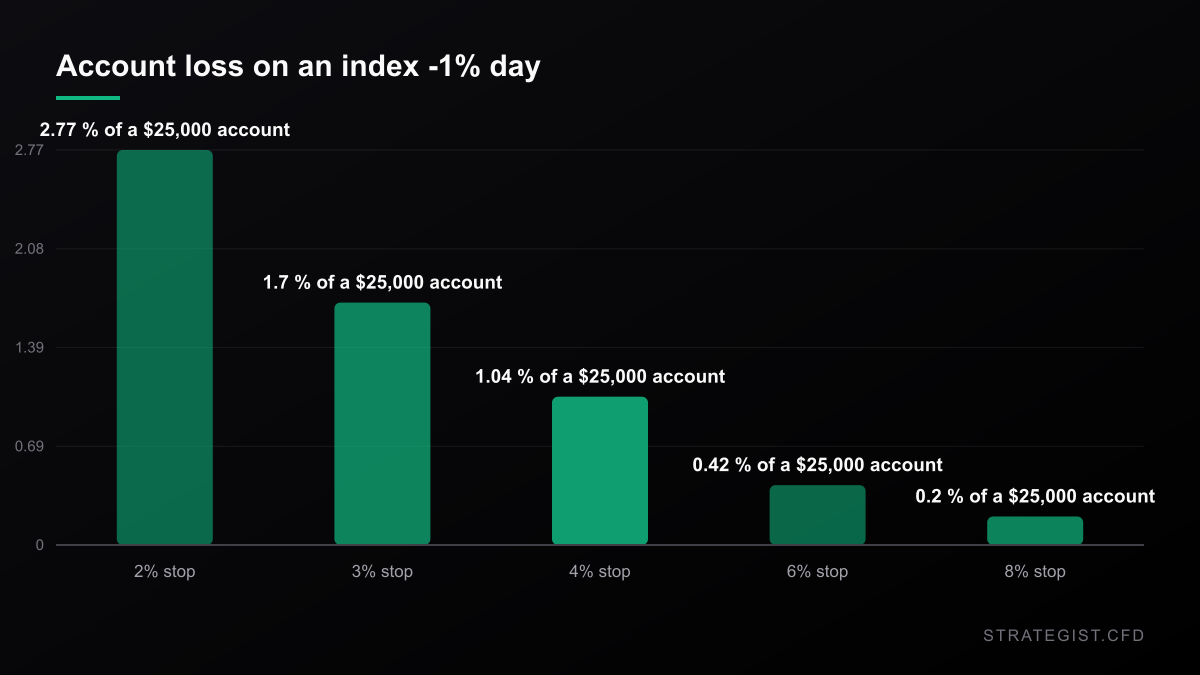
Take a $25,000 account risking 1% per position across five longs. With 2% stops, each position is $12,500 of notional, the book runs 2.5x equity gross, and the average shock day stops out 2.77 of the five — roughly 2.77% of the account in a single session, against a median index move of 1.59%. Push the stops out to 8% and the same day stops 0.20 of the five, costing 0.20%.
You don't get that for free. Fixed fractional risk means a wider stop is a smaller position: 2% stops are 0.50x equity per name, 8% stops are 0.13x. A 3% day in your favour pays $1,875 on the first book and $469 on the second. You are buying survival with upside, and on a day like Wednesday that trade looks reasonable — but it is a trade, not a rule.
Risk Analyzer
Quantify event-specific risks and calculate potential impact on your portfolio.
Why Position Sizing Matters More Than Entry Signals
Entry signals decide where you trade; position sizing decides whether you survive. Why capital allocation dominates entry precision in leveraged CFD markets, and how to build a sizing rule you can actually follow.
The bounce, and why it isn't a signal
The temptation after a hot CPI day is to buy the dip. Historically, buying the close of a −1% day has been slightly better than buying a random close: median five-day return +0.55% versus +0.31% unconditional, twenty-day +1.60% versus +1.19%. But the share of twenty-day windows that end positive is 61.2%, below the 63.2% baseline. Higher median, lower hit rate — that is more movement, not more direction. There is no edge here worth sizing up for.
Dispersion does persist, though. The median cross-sectional dispersion on the session after a shock day is 1.678, against 1.371 across all days. Whatever the index does, tomorrow is likely to be another wide one.
Where this goes wrong
Three things, in order of how much they should bother you. First, the thirty names were chosen today: they are the survivors, they are among the most liquid stocks in the world, and they track the index far more closely than a real book does. A book of mid-caps, or of anything with a story attached, will be worse than every number here. Second, Wednesday's session was still open when this was measured, so today's figures are mid-session and will move; every distribution they are compared against uses completed bars only, through Tuesday's close. Third, these are descriptive counts, not a model. The breach figures assume a stop parked a fixed percentage below the prior close, with no gap protection and no slippage on the fill — which in practice means the real cost is higher than 2.77%, not lower.
Method, so you can repeat it: daily OHLC for thirty US large caps plus ^GSPC, ^VIX and the nine sector SPDRs, pulled with yahoo-finance2, 2000-01-04 through 2026-10-13 for all statistics; a "shock day" is a completed session with the index down 1% or more, a "calm day" one where it moved less than 0.5% either way. Adverse excursions are measured on daily lows, forward returns are close-to-close and the twenty-day windows overlap.
What to actually do with it
- Calibrate stop distance from intraday lows, not closes. Closes hide about half the stop-outs.
- Before any event with a fixed release time, settle the stop distance first. It — not the entry — decides how much of the book survives.
- Count gross exposure into the print, not position by position. Five positions at 1% risk each are five percent of the account if they all stop on the same session, and on shock days they cluster.
- Stop reading a 1% index day as a 1% day for your book. On Wednesday the median name moved 1.53x the index, in the top 3% of shock days for that ratio.
- If you trade the index itself, ignore most of this: VIX at 16.45 says the index move was already priced.
Charts and analysis on this site are for research only and are not investment advice.
More in News
 News2026-10-31
The Nasdaq Just Entered Its Third Correction of 2026. The Closing Price Disagrees.
Three ways to measure Friday's drawdown give -9.09%, -10.03% and -10.42%. Which one your broker uses decides whether you survived it.
 News2026-10-31
The S&P Lost 1.82% on Friday. 64% of It Was Priced Before the Bell.
Semis fell 6.98%, the S&P 1.82%, and most of the move was an overnight gap. What the split between the gap and the session says about stop placement, fills and the one trade Friday actually set up.
 News2026-10-17
Oil Hit $110 and the Nasdaq Had Its Worst Week in 18 Months. That Pair Has No Precedent.
Brent closed at $109.86 on Friday and WTI gained 10.41% on the week. The Nasdaq 100 fell 5.49% over the same five sessions. In 1,084 weeks of data that pairing has never happened — here is what it means for a leveraged book.