Oil Hit $110 and the Nasdaq Had Its Worst Week in 18 Months. That Pair Has No Precedent.
Four numbers from Friday
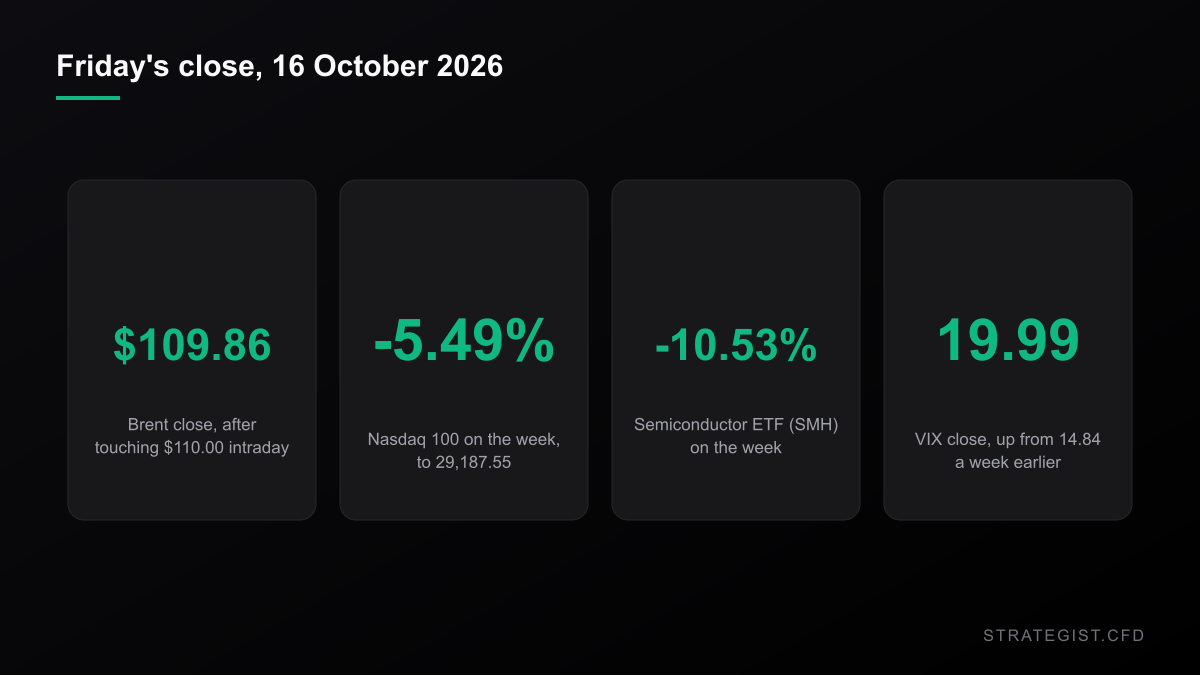
Brent closed at $109.86 on Friday 16 October after printing $110.00 intraday. Its last close above $110 was 19 May, when it settled at $111.28. WTI, the US benchmark most oil CFDs are priced off, closed at $101.41 — up 10.41% on the week, which sits in the 98th percentile of every week since 2006.
Over the same five sessions the Nasdaq 100 fell 5.49% to 29,187.55. The S&P 500 lost 1.95%, which sounds like the same story until you line the two up: -1.95% is the 14th percentile of weekly S&P moves. Unremarkable. The Nasdaq 100's -5.49% is the 2.5th percentile of its own history.
VIX closed at 19.99, up from 14.84 a week earlier. NBC News put the tech-sector wealth destruction at $1 trillion; CNBC attributed the oil move to Iran escalating attacks around Hormuz and Ukraine signalling it would target Russian refineries. Both of those are reported, not measured. I'll come back to why that distinction matters.
"Worst week in 18 months" is not a headline cliché
I counted it. Of 1,084 complete weeks of Nasdaq 100 data going back to January 2006, 27 were worse than the week that just ended. The most recent was the week of 31 March 2025, at -9.87%. That's 18.4 months — the headlines are accurate for once, which is rare enough to be worth saying.
Here's what the headline leaves out. The 18-month gap isn't a measure of how bad this week was. It's a measure of how quiet the last 18 months have been. A -5.5% week in the Nasdaq 100 is roughly a twice-a-year event: 36 weeks out of 1,084 closed down 5% or more, about 3.3%. What made this one feel unprecedented wasn't the depth. It was the company it arrived in.
The pair has no precedent
I looked for weeks where the Nasdaq 100 fell 5% or more while WTI gained 8% or more. There are none. Zero out of 1,084 weeks. If the two were independent you'd expect around two.
Loosen the thresholds and the count stays tiny. Nasdaq down 4%+ with Brent up 3%+: nine weeks out of 1,001, or 0.9%. Nasdaq down 5%+ with Brent up 3%+: four weeks, 0.4%. The most recent of those nine was the week of 13 July this year — Nasdaq 100 -4.2%, Brent +15.9%. It's not that the two never coincide. It's that when they do, you're working with single digits and every statistic you can compute is fragile.
So be careful with the word "precedent". It doesn't mean the market is broken. It means the conditional base rate you'd want before sizing up — when oil spikes and tech sells off together, what happens next? — is not available at any useful confidence. Nine observations, clustered in 2008, 2009, 2018, 2021, 2022 and 2026, is not a base rate. It's an anecdote with a spreadsheet attached.
Energy went up while semis went down
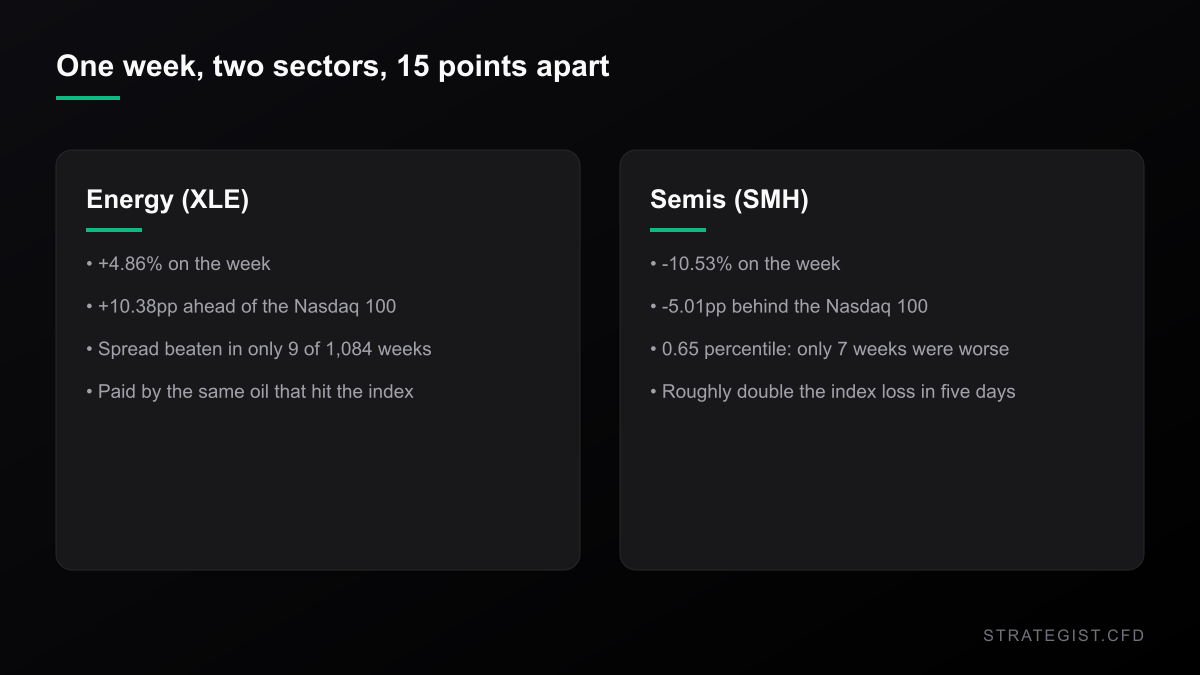
The index number hides where the money actually moved. XLE, the energy sector ETF, gained 4.86% last week. SMH, the semiconductor ETF, lost 10.53% — the 0.65 percentile of its weekly returns, with only 7 weeks out of 1,084 worse. That loss is very close to double the Nasdaq 100's own.
The gap between the two is the tradeable detail. XLE minus Nasdaq 100 was +10.38 percentage points on the week, a spread exceeded in only 9 of 1,084 weeks. SMH minus Nasdaq 100 was -5.01 points, in the bottom 1.3%. If you were long an index CFD and a semis position at the same time, you didn't have two positions. You had one bet twice, in the same direction, and the index number told you nothing about it.
Your correlation sign already flipped
There's a comforting story that runs: oil up, stocks down, so the long energy leg hedges the long tech leg. The rolling 52-week correlation of weekly returns between the Nasdaq 100 and WTI says that story expired a while ago. It currently reads -0.30. The median reading since 2006 is +0.24, and only 23.8% of all rolling windows have been negative at all.
Which means the negative correlation isn't a new hedge appearing just when you need it. It has been building for months — the last twelve readings run from -0.25 to -0.30, and the trailing 52-week figure is -0.33. A correlation matrix built back in August would already have shown you this. If you run the
Correlation Matrix
Analyze the statistical relationship between different assets to avoid over-exposure.
Oil Jumped 3% and Stocks Fell Anyway. That Combination Is Rare.
Brent went back above $105 on Thursday while the Nasdaq 100 dropped 1.45%. I pulled 2,601 aligned trading days since 2015 to see what a 3% oil day actually does — and what a 2% equity day does to everything else.
Where the stop has to sit on a week like this
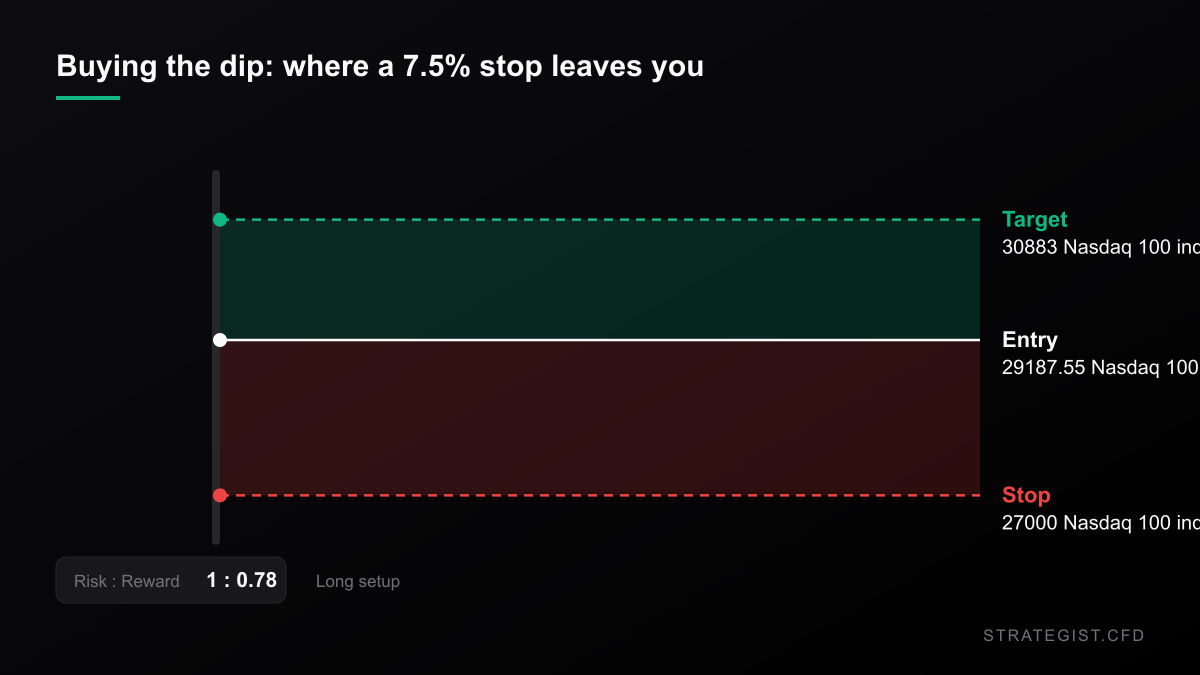
Take the 36 weeks the Nasdaq 100 closed down 5% or more and measure the deepest point of the week against the previous Friday's close — the excursion you'd have lived through if you were already long. Median: -7.53%. In 61% of them the week's low was more than 7% below the prior close. In 25%, more than 10%.
That's the number that should set your stop, and it isn't the one most people use. A 3% stop isn't tighter risk in a week like this — it's a certainty. The week closed 5.5% down, so anything inside that distance was touched at some point. You paid the full 3% for the privilege of being out before the recovery you were waiting for.
Work it the other way. Say you buy Friday's close at 29,187.55 with a stop at 27,000 — 7.5% away, just outside the median bad-week excursion — and a first target back at the previous Friday's close of 30,883. That's 1,695 points of reward for 2,188 of risk. Reward-to-risk: 0.78.
That's the honest shape of the trade, and it's why the answer usually isn't a cleverer entry. It's
Risk Analyzer
Quantify event-specific risks and calculate potential impact on your portfolio.
Why Position Sizing Matters More Than Entry Signals
Entry signals decide where you trade; position sizing decides whether you survive. Why capital allocation dominates entry precision in leveraged CFD markets, and how to build a sizing rule you can actually follow.
One more thing worth knowing: the honest version costs less to hold. On a $50,000 account risking 1% ($500), a 7.5% stop means $6,667 of notional; at 6.07% annualised financing (the 13-week bill at 4.07% plus a 2% broker charge) that's about $7.78 a week. The 3% stop needs $16,667 of notional and costs about $19.45 a week. You pay more to hold the version that gets stopped out.
Oil's weekly range doubled
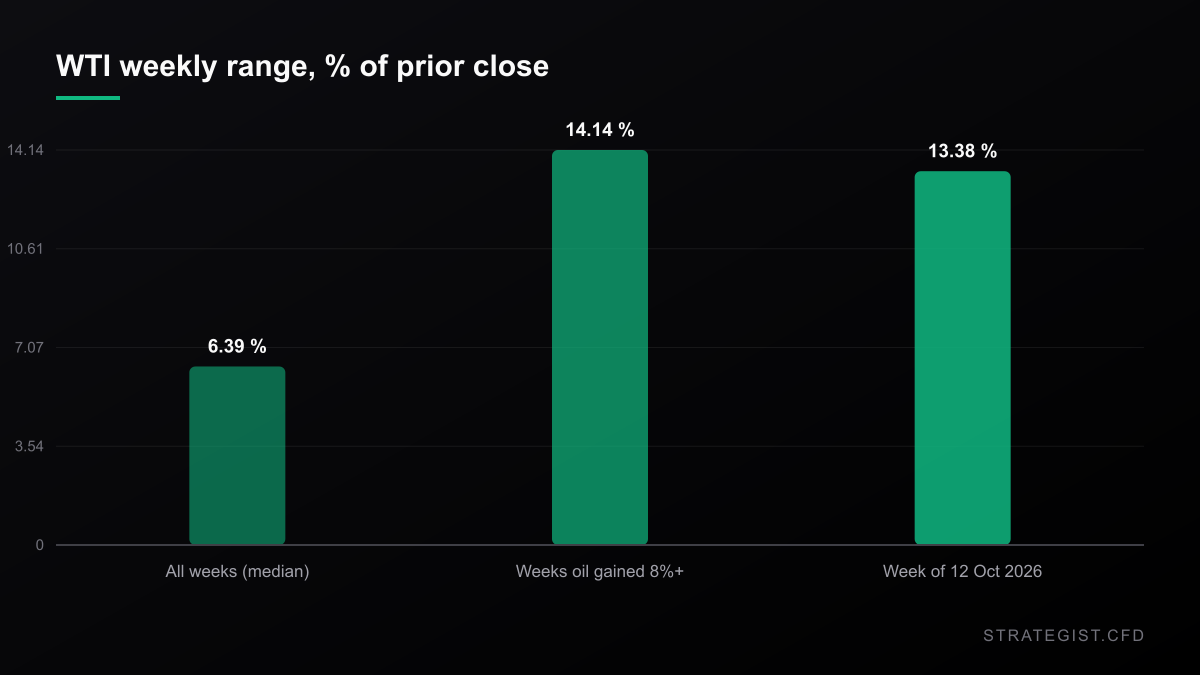
The other half of the book has its own arithmetic. WTI's weekly high-low range, measured against the prior close, was 13.38% last week. The median across all weeks is 6.39%. Across the 63 weeks where oil gained 8% or more, the median range is 14.14% — and 81% of those weeks ranged more than 10%, while 43% ranged more than 15%.
There's a second effect that catches people out. In percentage terms oil gets calmer as it gets expensive: the median weekly range is 4.14% when Brent is between $100 and $120, versus 7.50% when it's below $60. But each 1% is worth more money — $1.10 a barrel at $109.86 against $0.70 at $70. The percentage shrinks and the dollars grow. If your oil stop is set in dollars per contract rather than as a percentage, it just got tighter without you touching it.
Five for five: every $110 print this year was lower a month later
Now the part that argues against everything above. Brent closed above $110 five separate times this year — 20 March, 31 March, 30 April, 4 May and 19 May. One day later it was lower in all five. Four weeks later it was lower in all five: -14.9%, -0.3%, -19.3%, -16.1% and -28.5%.
Five observations is not a law of nature. But "oil broke a level, the story is escalating, therefore buy" has not paid once this year, not even on a one-day horizon. And the nine joint weeks say the same thing: Nasdaq 100 forward one week, median -1.74% against +0.45% unconditional, with only 2 of 9 higher. Brent forward one week, -2.25% against +0.33%. Both legs gave money back.
The obvious objection is that this time the supply shock is real and unresolved — Hormuz, Russian refining — while the March and May episodes were headline spikes that faded. Fair enough. My sample can't separate escalating from fading, because I have no way to score the news, only the price. What I can say is that the market has paid up for escalation repeatedly this year and then taken it back, and that the one thing you shouldn't do is assume this episode is the exception because the story sounds scarier.
The week after is not where the pain stops
After those 35 prior Nasdaq weeks of -5% or worse, the following week's median return was +1.08% against +0.42% unconditional, and 63% of them closed higher. Twelve weeks out the median was +8.25% against +4.29%. It's tempting to read that as a buy-the-dip signal.
Don't. Two problems. The sample is 35 weeks and it clusters hard in 2008, 2020 and 2022 — 14 of the 35 come from those three years alone, so the median is mostly a statement about crisis recoveries. And the median hides the path: the week right after a -5% week has a median worst excursion of -2.95%, against -1.37% for a random week. A bounce and a survivable bounce are different things, and only the second one matters when you're leveraged.
What to do with this on Monday
- Size off the excursion, not the close. The median bad week travels 7.5% below the prior close before it closes down 5.5%. If your stop can't accommodate that, your position is too big — not your stop too tight.
- Re-run your correlation matrix before assuming the energy leg hedges the tech leg. The 52-week correlation is already negative and has been since summer. Nothing new appeared on Friday.
- Price the weekend gap. Brent's Sunday open is where the Hormuz news gets marked. A stop sitting inside Friday's range is not protection against it.
- Check your oil stops in dollars, not percent. Each 1% is $1.10 a barrel now.
- If you're tempted to buy the oil breakout, know you're taking the other side of a 5-for-5 record this year. That doesn't make it wrong. It does put the burden of proof on the trade rather than on the base rate.
Method, so you can check it: daily bars from Yahoo Finance through the close of 16 October 2026; weeks are calendar weeks, Monday to Friday; the Nasdaq 100 series is the QQQ ETF as a proxy for the index, the index itself fell 5.49%. There are 1,084 weeks for QQQ and WTI from January 2006 and 1,001 for Brent, which starts in July 2007. Excursions are measured from daily lows, so true intraday moves were deeper than the figures here. These are descriptive statistics on price history, not a backtest of any strategy — nothing here was traded.
Charts and analysis on this site are for research only and are not investment advice.
More in News
 News2026-10-31
The Nasdaq Just Entered Its Third Correction of 2026. The Closing Price Disagrees.
Three ways to measure Friday's drawdown give -9.09%, -10.03% and -10.42%. Which one your broker uses decides whether you survived it.
 News2026-10-31
The S&P Lost 1.82% on Friday. 64% of It Was Priced Before the Bell.
Semis fell 6.98%, the S&P 1.82%, and most of the move was an overnight gap. What the split between the gap and the session says about stop placement, fills and the one trade Friday actually set up.
 News2026-10-16
Everyone Expects a Fed Hold on 28 October. The Range Doesn't.
Kevin Warsh gave the market nothing last week and traders pushed October hike odds below 30%. The decision lands 2:00 PM ET on Wednesday 28 October. Two thirds of FOMC meetings since 2015 ended with no change - and those days still ran a range about a quarter wider than normal.