Oil Jumped 3% and Stocks Fell Anyway. That Combination Is Rare.
Thursday, mid-session
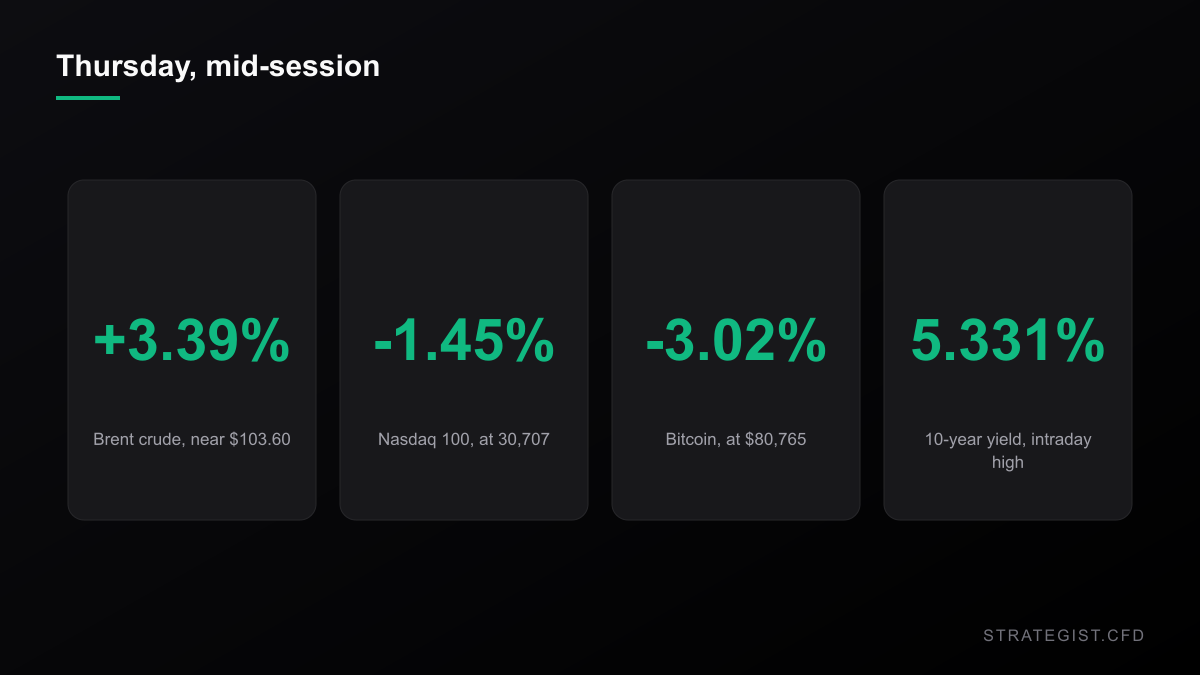
Brent crude printed a high of $105.91 on Thursday before settling near $103.60 in afternoon New York trade, up 3.39% on the day. WTI was up 3.12% at $91.03. The trigger was a familiar one: fresh attacks on shipping in the Gulf, and Barron's describing global reserves as “scarily thin.”
What came next wasn't a bloc. The Nasdaq 100 was down 1.45% at 30,707. The S&P 500 down 0.65%. The Dow down 0.17% — nothing, really. Gold was up 0.18% at $4,148 while silver was down 1.32% at $59.11. Bitcoin was down 3.02% at $80,765 and ether down 6.12% at $2,416. The 10-year yield touched 5.331% intraday and came back to 5.25%.
That's a messy tape. The headline version — oil up, inflation fear back, stocks down — is tidier than what actually happened. Silver fell while gold rose. The Dow held while the Nasdaq dropped one and a half percent. If you were holding four or five CFD positions into this, some of them went your way and some didn't, and the ones that didn't probably weren't the ones you'd have guessed.
What a 3% oil day has actually done
So I went and measured it. Daily closes for nine instruments — S&P 500, Nasdaq 100, gold, silver, WTI, bitcoin, EUR/USD, the 10-year and the dollar index — from January 2015 through 6 October 2026, aligned on days when all nine traded. That's 2,601 observations. Thursday isn't in any of it; US markets were still open when I pulled the data, and an unfinished bar is not a data point.
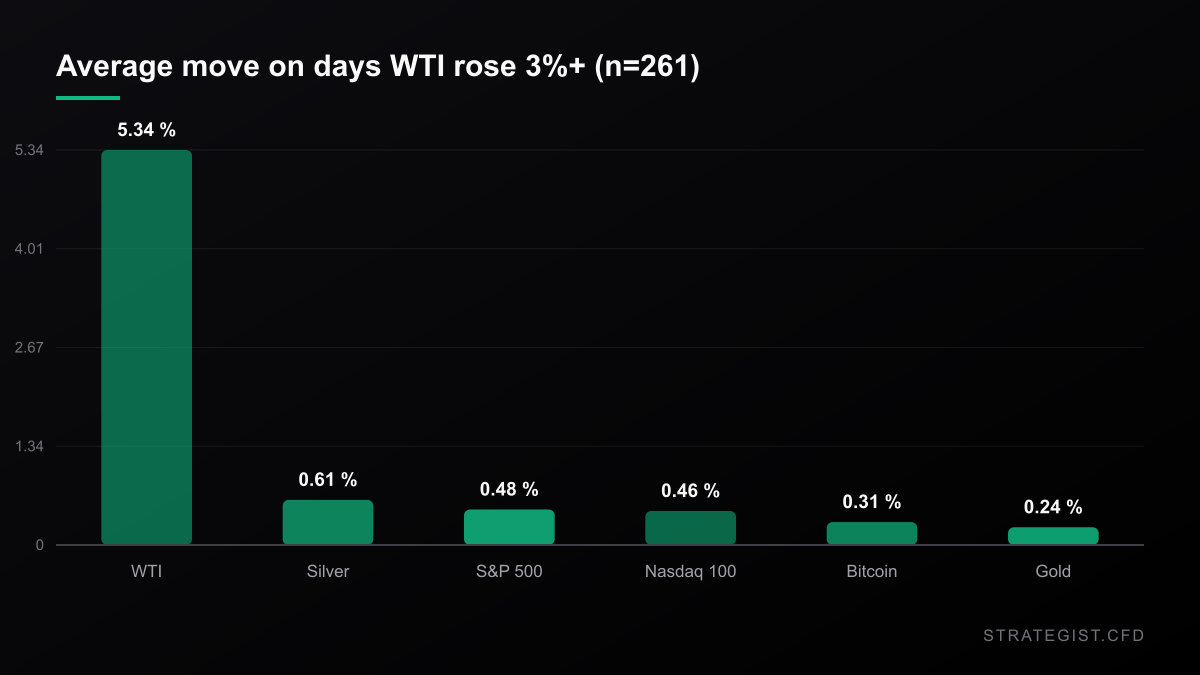
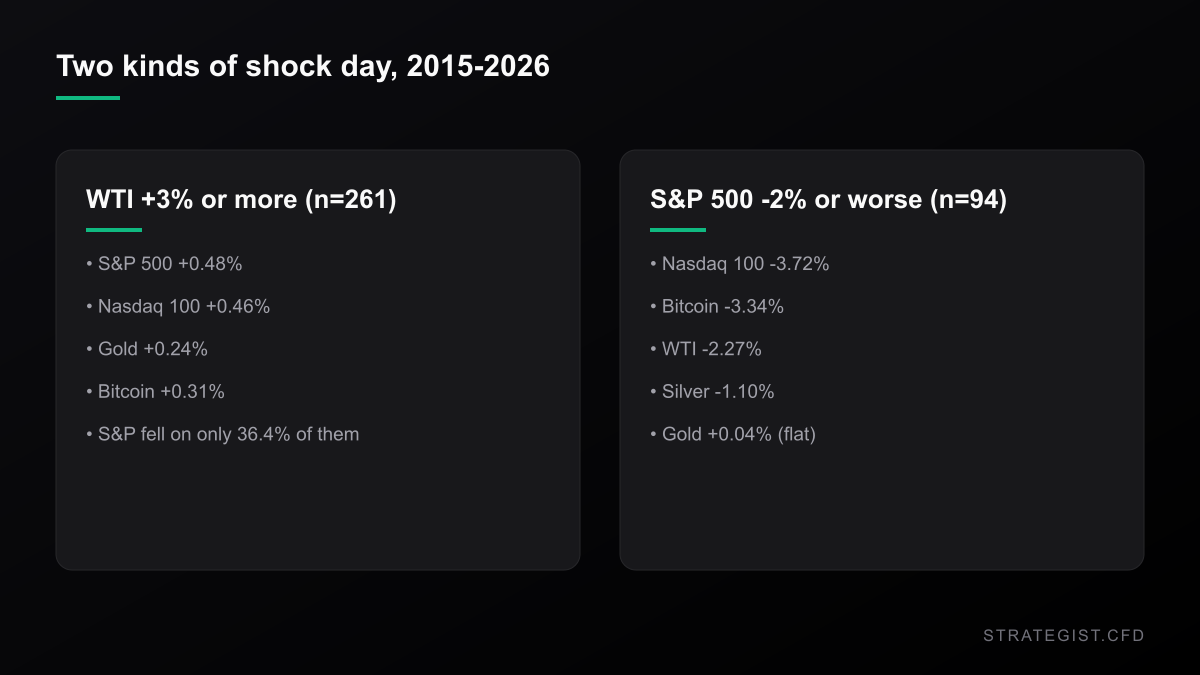
WTI has risen 3% or more on 261 of those days, right about 10% of the sample. On those days the S&P 500 averaged +0.48%, against +0.01% on everything else, and closed higher 63.6% of the time. The Nasdaq 100 averaged +0.46%. Silver +0.61%. Gold +0.24%, and up on 59.8% of them.
The version in the headlines — oil up, stocks down — turned up on 95 of those 261 days. That's 36.4%. Tighten it to days when the S&P actually fell something worth naming, 0.5% or more, and you get 51 days. 19.5%.
I don't want to oversell this. A +0.48% average is small, and those 261 days aren't a random draw — oil spikes cluster around supply events, and supply events cluster around geopolitics. But the direction of the surprise is the interesting part. Over eleven years a big oil rally has been mildly good for equities, not bad for them. Thursday is the exception, not the rule. And the forward returns are close to nothing: the S&P averaged +0.04% the next day and +0.14% five days out, against unconditional baselines of +0.06% and +0.05%. I wouldn't trade the difference.
The clustering runs the other way
Where the tape genuinely moves as one is on equity shocks, not oil shocks.
Since 2015 the S&P has fallen 2% or more on 94 days. On those days the average Nasdaq 100 move was -3.72%. WTI -2.27%. Bitcoin -3.34%. Silver -1.10%. Gold +0.04% — flat, and negative on half of them.
Bitcoin fell harder than the S&P on 48.9% of those days; oil did on 31.9%. So the book that looks diversified on paper — an index, a metal, a crypto, an energy leg — isn't diversified on the day you needed it. Three of the four are down, and two of them are down more than the thing you were actually worried about.
Gold, the leg people add precisely for this, averaged four hundredths of a percent. It didn't cost you money. It didn't make you any either. Which, to be fair, is more than the Nasdaq did.
Correlation Matrix
Analyze the statistical relationship between different assets to avoid over-exposure.
Correlations rise under stress — just less than the folklore says
The reflex explanation is that correlations go to one in a crisis. Occasionally they do. In this data the effect is real and it is smaller than the story.
Take five assets — Nasdaq 100, gold, silver, bitcoin, WTI — and average all ten pairwise correlations. On ordinary days that average is 0.134. On days when the S&P moved 1.5% or more in either direction, it's 0.270. A 2.02x jump, and it's genuinely there.
But correlation is only half of portfolio risk. On those same days the root-mean-square daily move across the five went from 3.70% to 5.16%, a 1.39x increase. Put both into an equal-weight portfolio and its daily standard deviation goes from 2.05% to 3.33% — 1.62x. Now decompose it: hold volatility flat and let only correlation rise and you get 1.16x. Hold correlation flat and let only volatility rise and you get 1.39x.
Roughly two-thirds of the extra risk is bigger moves. One-third is tighter correlation. If you spend your time on correlation and not on size, you're working the smaller problem.
Four tickets, 2.2 trades
There's a compact way to see what correlation does to a book. Effective independent bets = N / (1 + (N-1)ρ). Four positions at ρ = 0.27 is 2.21 bets. Four positions at zero is four.
And the largest correlations in this sample aren't the exotic cross-asset ones people lie awake about — they're the boring duplicates. S&P 500 and Nasdaq 100 correlate at 0.934 across the full sample. Gold and silver at 0.774. If you're long US500 and long NAS100, or long XAU/USD and long XAG/USD, you don't have two positions. You have one position, two spreads, and two overnight financing charges.
One more honest note before this turns into a warning: the broad nine-asset basket's rolling 63-day average pairwise correlation is 0.048 today. That's the 41st percentile of the last decade — completely unremarkable. The median is 0.060, the peak was 0.231 in 2020. Nothing about the current correlation structure is flashing red. Everything above describes what happens on bad days. It is not a claim that one is coming.
What one percent of risk actually buys
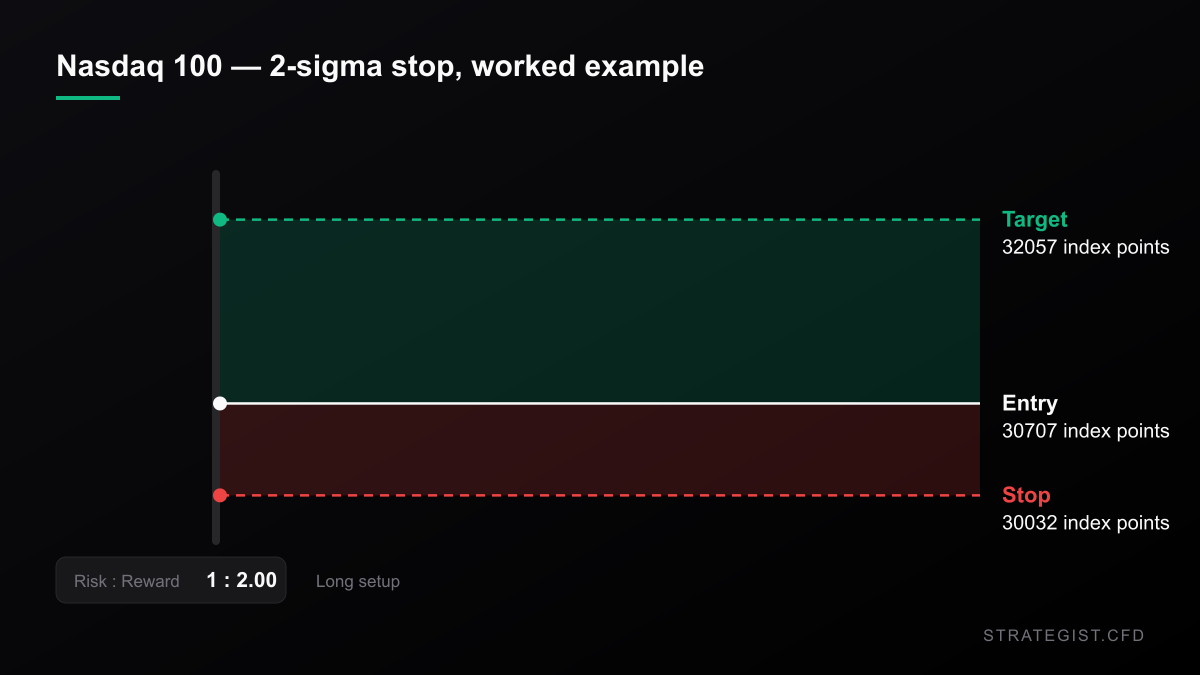
Here's the arithmetic that matters. $25,000 account, 1% risk per position — $250 — with each stop placed at two standard deviations of the last 20 sessions:
- Nasdaq 100: 20-day sd 1.10%, 2σ stop 2.20% → $11,373 notional, 0.45x
- Gold: sd 1.28%, stop 2.56% → $9,750 notional, 0.39x
- Bitcoin: sd 3.49%, stop 6.98% → $3,580 notional, 0.14x
- WTI: sd 3.22%, stop 6.43% → $3,887 notional, 0.16x
Total notional $28,590 — 1.14x the account. Four positions and you're barely levered, because the volatile legs get cut down to almost nothing. That's the whole point of sizing off the stop: it shrinks the legs that move the most.
The same four legs, sized two ways
Run that book through the average S&P -2% day. Risk-sized as above it loses $627, or 2.51% of equity. Your nominal budget across four positions was $1,000, so the outcome is gentler than the sticker suggests — the tiny bitcoin and oil notionals are doing exactly what they're supposed to.
Now size the same four legs at 1x notional each, $25,000 apiece. Same day, same views: $2,325, or 9.30% of equity. That's 3.70x the loss for identical directional opinions.
The frequency gap is wider than the severity gap. The risk-sized book loses 2% or more of equity on 116 of 2,598 days — 4.46% of the time. The equal-notional book does it on 770 days: 29.64%. Worse than 4%: 14 days versus 448.
Nobody opens the second book on purpose. They arrive at it by putting on four positions that each feel like the same size.
Risk Analyzer
Quantify event-specific risks and calculate potential impact on your portfolio.
Where I could be wrong
A few places. The 94 bad equity days are not independent observations — they cluster in March 2020, June 2022 and April 2025, so the effective sample is much smaller than the number suggests and the averages lean on a handful of episodes. Same problem with the 261 oil days.
Everything measured here is same-day co-movement. It says nothing about cause, and nothing about what happens next. I did run the forward returns; they're close to baseline, which is why they're mentioned once and then dropped.
The conditioning was chosen after looking at Thursday's tape, which is exactly how you end up finding the result you were half-hoping for. The oil-day finding in particular would move if I'd used a 2% threshold, or started in 2010, or used Brent instead of WTI. I didn't test those, so I can't tell you they'd agree.
And these are eleven-year averages, not a system. No financing, no spreads, no slippage, no gap risk through a weekend. The WTI continuous contract also did something physically impossible in April 2020 — it went negative — and I removed those three days rather than let them dominate the tail statistics.
What to do with this
- Before adding a leg, check what it correlates with at 0.9 or above. Two index CFDs, or two metals, aren't diversification — they're one bet with duplicated carry.
- Size off the stop distance, not off round numbers. The two books above differ by 3.70x on the same day.
- Measure volatility before you measure correlation. In this sample it was roughly twice the effect.
- Re-measure your stops after a shock. Two sigma of the last 20 sessions is a different number on Friday than it was on Wednesday, and Wednesday's stop is now wrong in one direction or the other.
- Count effective bets, not tickets. Four positions at ρ = 0.27 is 2.2.
Why Position Sizing Matters More Than Entry Signals
Entry signals decide where you trade; position sizing decides whether you survive. Why capital allocation dominates entry precision in leveraged CFD markets, and how to build a sizing rule you can actually follow.
Nasdaq Up 3%, Dow Down 3.5%: What a Split Month Does to Your Stop
Core PCE printed 3.0% against 3.3% expected, and the tape answered unevenly: Nasdaq 100 up, Dow down. September's gap between the two sits in the top 7% of months since 1992, and it changes the stop distance you should be using.
Charts and analysis on this site are for research only and are not investment advice.
More in News
 News2026-10-31
The Nasdaq Just Entered Its Third Correction of 2026. The Closing Price Disagrees.
Three ways to measure Friday's drawdown give -9.09%, -10.03% and -10.42%. Which one your broker uses decides whether you survived it.
 News2026-10-31
The S&P Lost 1.82% on Friday. 64% of It Was Priced Before the Bell.
Semis fell 6.98%, the S&P 1.82%, and most of the move was an overnight gap. What the split between the gap and the session says about stop placement, fills and the one trade Friday actually set up.
 News2026-10-17
Oil Hit $110 and the Nasdaq Had Its Worst Week in 18 Months. That Pair Has No Precedent.
Brent closed at $109.86 on Friday and WTI gained 10.41% on the week. The Nasdaq 100 fell 5.49% over the same five sessions. In 1,084 weeks of data that pairing has never happened — here is what it means for a leveraged book.