Consumer Sentiment Just Printed 46.3. The S&P Closed at a Record the Same Day.
Friday's number, and the record it shared a date with
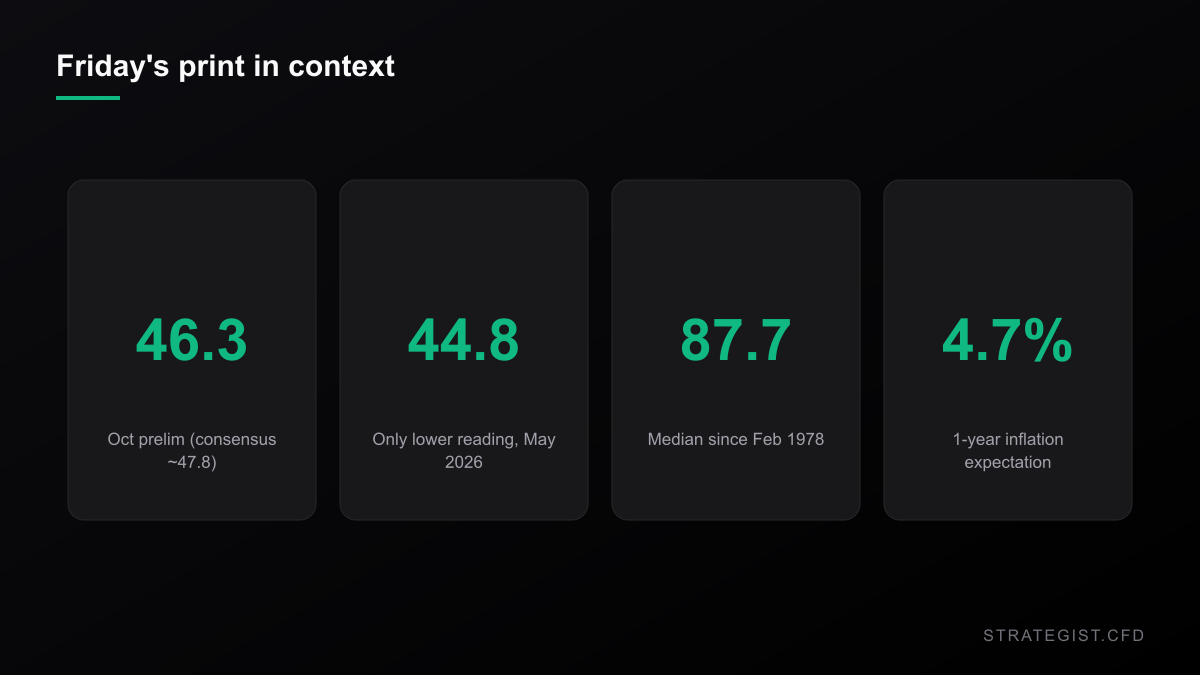
At 10am on Friday 9 October the University of Michigan's preliminary consumer sentiment index came in at 46.3 — against a consensus near 47.8 and a prior reading of 48.1. Bloomberg led with a five-month low, which is technically true and badly understated. I pulled the monthly series from FRED back to February 1978: 583 readings, median 87.7, and exactly one month in the whole history lower than this one — 44.8 in May 2026. That puts 46.3 in roughly the 0.2nd percentile, the second-lowest print in forty-eight years.
The same session, the S&P 500 closed at 7,809.89, up 0.57%, three sessions after its record close of 7,818.93 on 6 October. The VIX finished at 14.83. Realised volatility over the last twenty sessions annualises to 9.8% — quieter than the index has been in most months of this cycle. So the consumer is reporting the worst conditions in the survey's history while the equity market sits within a tenth of a percent of an all-time high, with volatility asleep.
One more piece of that print: the one-year inflation expectation came in at 4.7%, up on the month. Headline CPI in August ran 3.71% year-over-year. Those two numbers are a percentage point apart, which turns out to be almost exactly this survey's typical miss. More on that below.
Why the mood reading doesn't match anything else
Deep lows in this survey have historically arrived with a labour market in pieces. Of the twenty lowest readings since 1978, the unemployment rate at those months ranged from 3.5% to 9.0%, with the 2008-09 cluster up at 9.0%. This one arrived with unemployment at 4.2% in September, against a 5.7% median across the whole 1978-2026 sample. Across all 583 months the correlation between sentiment and unemployment is -0.28. Real, but weak — the survey is picking up something the labour data isn't showing, or something that hasn't reached the labour data yet.
Cost of living is the obvious candidate. A 4.7% expectation against a realised 3.71% says households feel prices running a point hotter than they are. So I checked how good that component has been as a forecast: comparing each month's one-year expectation with the CPI actually realised twelve months later, across 571 months, the median error is +0.23 points and the median absolute error is 1.01 points. Only 49.7% of readings land within a point. In 2021 the survey said 3.0% and got 7.6%. In 2025 it said 6.6% and got 4.2%.
That makes the expectation component a thermometer with a one-point calibration error whose sign flips by regime. It is not a forecast you can build a rate path on — which matters right now, because the Fed is debating a hike rather than a cut, and Reuters reported on 2 October that December is the live meeting.
What the tape did next, the last few times the mood was this bad
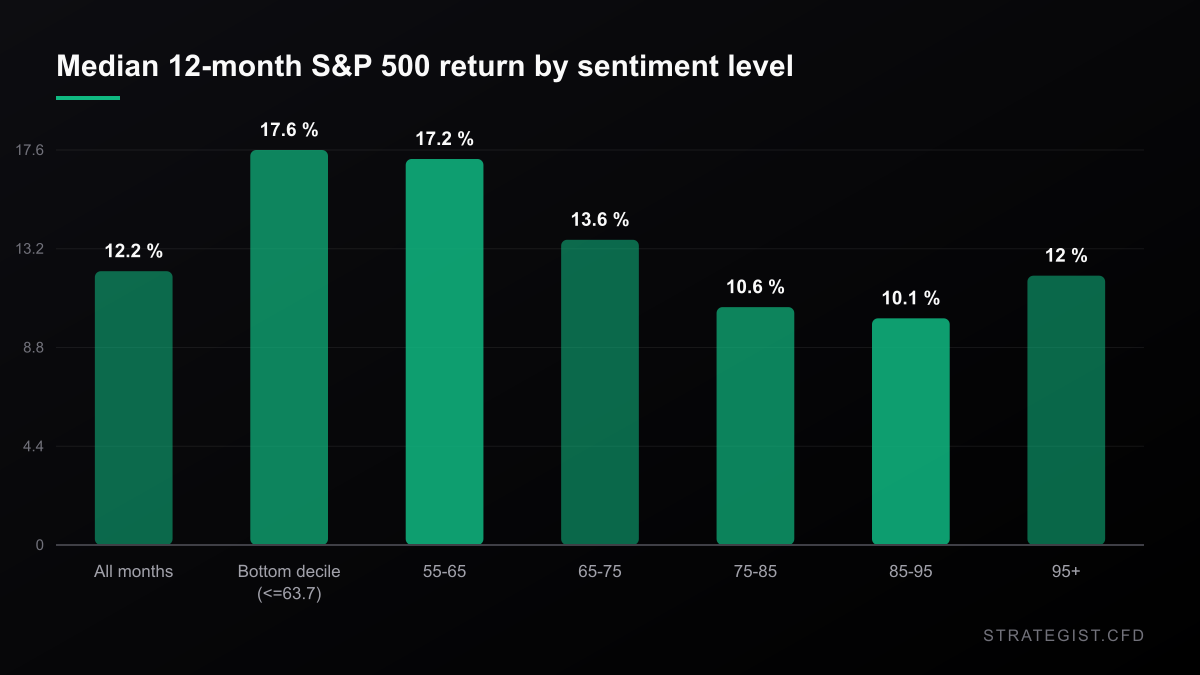
This is the part that surprised me. I took every month since 1978, sorted by the sentiment reading, and measured the S&P 500's return over the following twelve months from the month-end close. Unconditionally the median twelve-month return is +12.2%, with 80% of months positive. Restrict to the bottom decile of sentiment — 63.7 and below, 59 months, 49 of them with a completed year — and the median goes up, to +17.6%, with 86% positive.
Go further down. Sentiment below 55 has happened in fourteen months since 1978, and only seven of them have a completed twelve-month outcome yet. All seven were positive: +25.0% and +19.2% (April and May 1980), +17.6% and +11.1% (June and July 2022), +29.4%, +28.2% and +14.2% (April, May and October 2025). Median +19.2%.
And the combination that actually describes Friday — sentiment in the bottom decile while the index sits within 2% of its own twelve-month high — has occurred in 21 months, 12 of them with a completed year. Median forward return +19.0%, all twelve positive, range +7.6% to +32.1%. Every month from June to October 2025 was one of these: the mood in the bottom decile, the index at a high, and a year later it was 14% to 21% higher.
None of this says the survey is bullish. It says the survey is not bearish, which is a different claim — and it's the one the data supports.
The trade everyone reaches for is the short
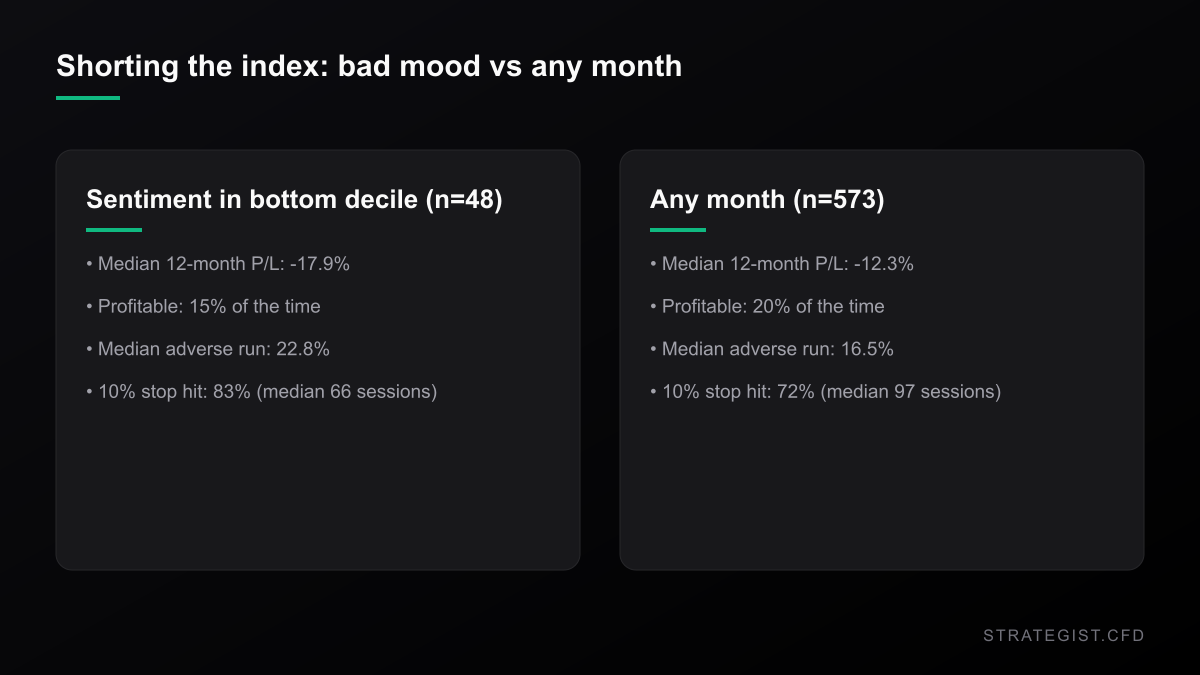
A record-low mood print alongside a record-high index invites one obvious position. So I priced it: short the index at the month-end close of each low-sentiment month, hold for 252 trading days.
For the bottom-decile months, the median short lost 17.9%. Fifteen percent were profitable. The median worst adverse excursion — the highest intraday print against the entry over the year — was 22.8%, and the 90th percentile was 37.7%. A protective stop 10% above entry would have been hit in 83% of them, at a median of 66 sessions in.
That's worse than shorting at random. Across all 573 months with a full year of forward data, the same short has a median loss of 12.3% and is profitable 20% of the time. Conditioning on terrible sentiment took a bad trade and made it worse: you pay the same carry for a position that loses more, because the index tends to be higher in twelve months and the path tends to go up first.
Restrict to the six genuinely extreme prints — below 55, with full data — and it gets uglier: zero of six profitable, median -19.0%, median adverse run 28.9%, and a 10% stop hit in all six at a median of 39 sessions. The two 1980 episodes ran 33.6% and 27.6% against the position before turning. The two 2025 episodes ran 30.6% and 28.9%.
What one percent of risk actually buys here
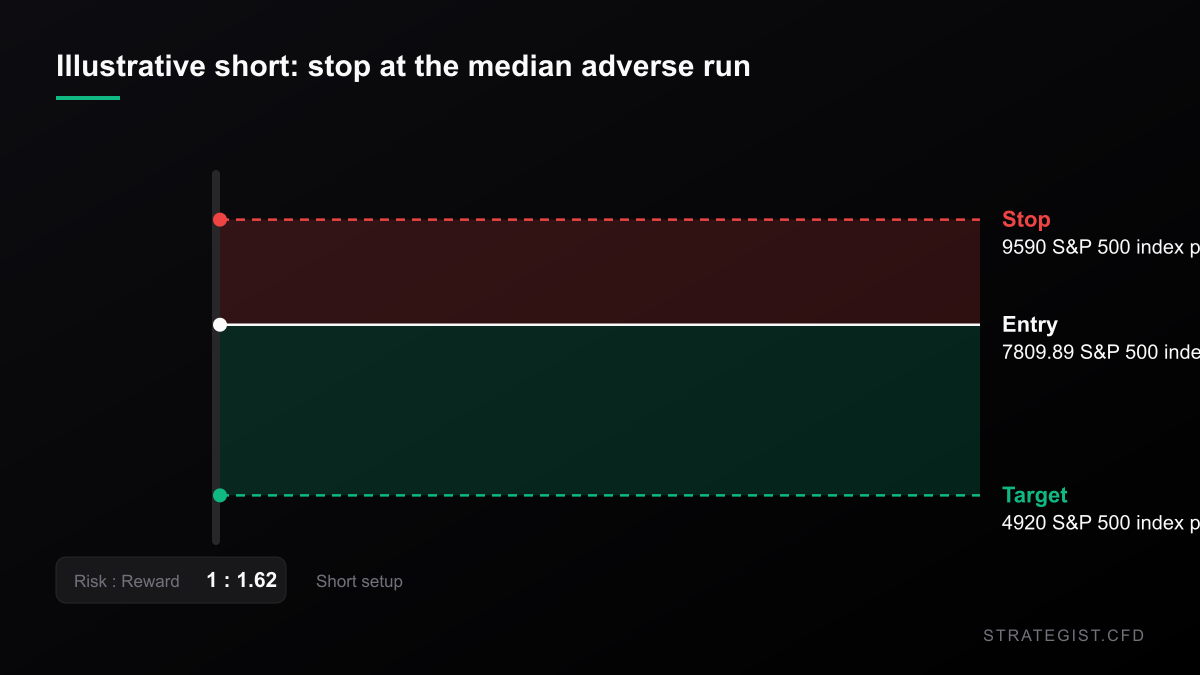
Take a $25,000 account and the standard 1% risk budget: $250. The historical median adverse excursion for a short entered on a bottom-decile print is 22.8%. A stop that wide means the notional you can carry is $250 / 0.228, or about $1,100 — roughly four percent of the account, 0.04x. Round the stop to 25% and it's $1,000. Even if you tighten to 10%, which the data says gets hit 83% of the time, you're at $2,500 notional, 0.10x.
Then there's the clock. The 13-week bill printed 4.057% on Friday; add a two-point financing markup and a short index position costs roughly 6.06% a year to hold. At the 0.04x you can actually afford, that's about $61 a year — irrelevant. At 1x notional it's $1,514 a year, or six times your per-trade risk budget, spent on the privilege of being early. That gap is the whole argument: carry scales with the size you want, and the size you can risk is the size at which the trade stops mattering.
The levels chart above is a worked example, not a recommendation: entry at Friday's close, stop at the median historical adverse run, target at 2008's worst outcome of -37%. It pays about 1.6R. The geometry is the point — an enormous stop, a tail-event target, a notional too small to care about.
Where this view breaks
The obvious objection, and it's a good one: seven observations is not a base rate. The sub-55 sample with completed outcomes is seven months drawn from three regimes — 1980, 2022 and 2025. Two of those three ended in recessions the survey arguably called early rather than wrongly. If the 2020s have re-linked consumer mood to equity returns in a way the 1980s didn't, none of these medians mean anything.
2008 is inside the sample and it's the case everybody remembers. Readings of 62.6, 59.8, 56.4, 61.2 and 63.0 across April to August 2008 were followed by twelve-month returns of -37.0%, -34.4%, -28.2%, -22.1% and -20.4%. The base rate survives that because 2008 is five months out of forty-nine. If you're the trader who only takes the trade once the tail shows up, you don't get the base rate — you get the tail, once.
There's also a horizon problem. A twelve-month window isn't how most CFD positions work. I measured it this way because the survey is slow — month-to-month autocorrelation 0.96 — so a mood trade only makes sense over a long horizon. But a year-long short financed at 6% is a different instrument from a two-week swing, and nothing here speaks to the latter.
And the mechanism is missing. I have no evidence the survey causes anything. It may simply be that by the time sentiment is this low, positioning is already defensive and the marginal seller is gone. That story fits the numbers and I haven't tested it.
Next week is the part you can actually act on
Reuters' week-ahead on Friday put it plainly: September CPI, retail sales and the start of Q3 bank earnings all land in the week of 12-16 October, with the index near records.
The sentiment number doesn't give you an entry. The calendar does give you a map of when execution gets expensive — spreads widen and gaps get bigger around CPI and the earnings open, and a stop set at Wednesday's width is wrong by Friday. If you carry index exposure into that week, the question isn't whether 46.3 is bullish or bearish. It's whether your stop distance was chosen with a data release sitting in front of it.
The short version
- 46.3 is the second-lowest Michigan reading in 583 monthly prints since 1978; the S&P closed within 0.1% of a record the same day. Both things were true in every month from June to October 2025.
- Low sentiment hasn't been a bearish signal in this data: bottom-decile months returned a median +17.6% over the next year, versus +12.2% unconditionally.
- The short is the worse trade: median -17.9% at bottom-decile prints versus -12.3% at random, with a median 22.8% adverse run and an 83% hit rate on a 10% stop.
- At 1% risk, a stop wide enough to survive that run leaves you with about 0.04x notional. The trade that fits your risk budget is too small to matter.
- Don't build a rate path on the 4.7% inflation expectation. The survey's median absolute miss over 571 months is 1.01 points, and the sign of the error flips by regime.
How I measured this
S&P 500 daily OHLC from Yahoo Finance (^GSPC, 1978-01-03 to 2026-10-09); sentiment, inflation expectations, unemployment and CPI from FRED (UMCSENT, MICH, UNRATE, CPIAUCSL). Each sentiment month is matched to its month-end close, so entries are always after the print; forward returns run twelve months. The short statistics use 252 trading days from the same entry, with adverse excursion measured on intraday highs. No financing, spreads or slippage unless stated. One-off scripts, not the site's backtest engine.
Risk Analyzer
Quantify event-specific risks and calculate potential impact on your portfolio.
Correlation Matrix
Analyze the statistical relationship between different assets to avoid over-exposure.
Why Position Sizing Matters More Than Entry Signals
Entry signals decide where you trade; position sizing decides whether you survive. Why capital allocation dominates entry precision in leveraged CFD markets, and how to build a sizing rule you can actually follow.
Charts and analysis on this site are for research only and are not investment advice.
More in News
 News2026-10-31
The Nasdaq Just Entered Its Third Correction of 2026. The Closing Price Disagrees.
Three ways to measure Friday's drawdown give -9.09%, -10.03% and -10.42%. Which one your broker uses decides whether you survived it.
 News2026-10-31
The S&P Lost 1.82% on Friday. 64% of It Was Priced Before the Bell.
Semis fell 6.98%, the S&P 1.82%, and most of the move was an overnight gap. What the split between the gap and the session says about stop placement, fills and the one trade Friday actually set up.
 News2026-10-17
Oil Hit $110 and the Nasdaq Had Its Worst Week in 18 Months. That Pair Has No Precedent.
Brent closed at $109.86 on Friday and WTI gained 10.41% on the week. The Nasdaq 100 fell 5.49% over the same five sessions. In 1,084 weeks of data that pairing has never happened — here is what it means for a leveraged book.