Goldman Sees USD/JPY at 150. Carry Eats 53 Percent of the Move.
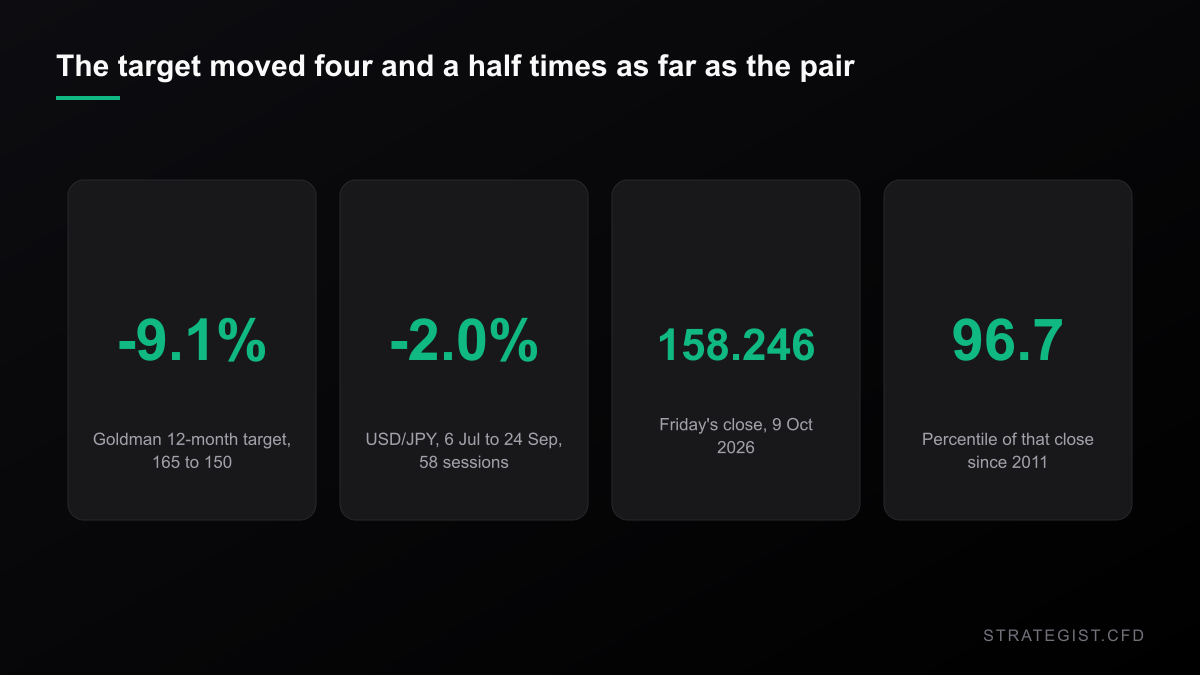
On 6 July, Bloomberg reported that Goldman Sachs put its twelve-month USD/JPY forecast at 165. By 24 September the same desk was quoting 150. That is a 9.1 percent move in a number whose entire job is to sit still for a year.
Over the same stretch the pair went from 162.088 on 6 July to 158.811 on 24 September — a shade over 2 percent across 58 trading days. The forecast travelled about four and a half times as far as the thing it was forecasting.
That is not a dig at Goldman. Forecasts get revised; that is what they are for. But if you trade off published targets, the revision history belongs in your notes next to the level. A number that can move 9 percent in a quarter is not a precise destination.
Two targets, eighty days apart
Where 150 actually sits
Friday close was 158.246. Getting to 150 means a fall of 5.21 percent — about 825 pips, or 8.25 yen.
Here is the part worth sitting with. The last time USD/JPY closed at or below 150 was 5 October 2025, at 149.606. That is 369 calendar days ago, and since that close the pair is up 5.78 percent. So the target is not a forecast of somewhere new. It is a round trip back to a level the market was standing on a year ago.
Nor is the pair stretched to any extreme. Friday close is in the 96.7th percentile of closes since 2011, but only 3.43 percent below the record close of 163.864 set on 28 July, and mid-range for 2026, which has run 152.278 to 163.979. High, but not a spike.
How often the pair does a 5.2 percent year
I ran the base rate on Yahoo daily closes for USD/JPY from January 2011 through Friday: 4,106 sessions, one observation per rolling 252-trading-day window, 3,854 windows.
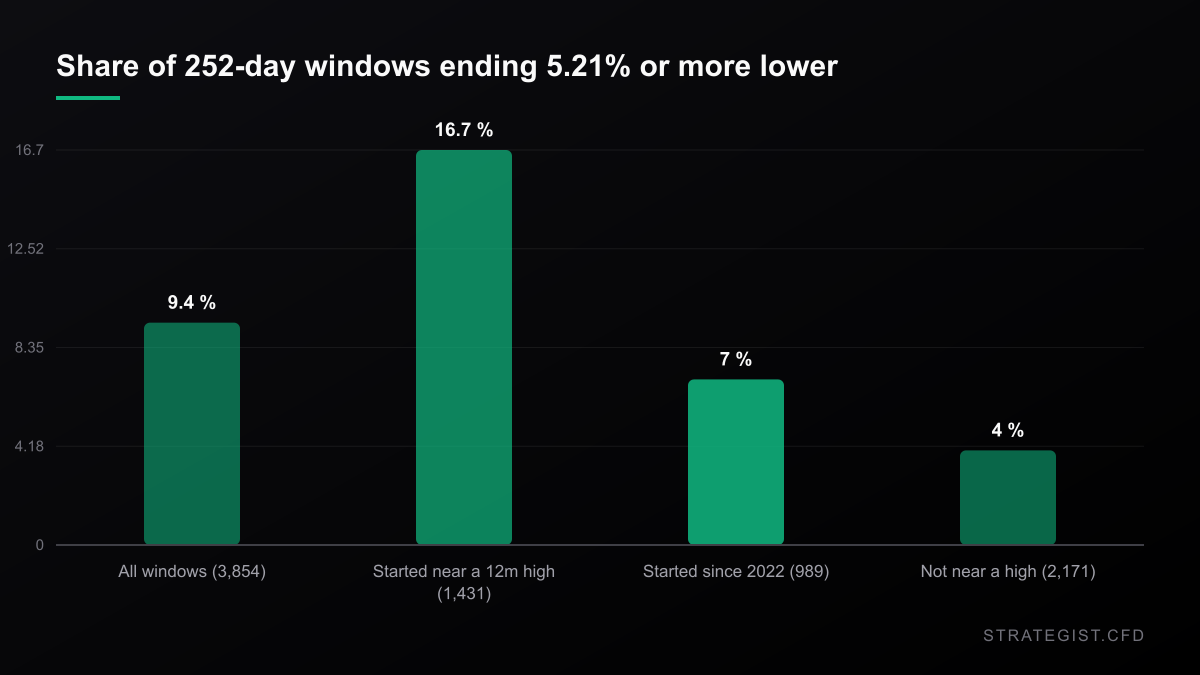
The median twelve-month change is +2.98 percent. The pair drifts upward, because for most of that period the carry ran one way. Only 9.4 percent of windows finished 5.21 percent or more below where they started. A third ended lower at all, and 48.5 percent finished inside plus or minus 5 percent.
Rolling windows overlap, so the honest sample is the non-overlapping one: sixteen independent years. Two of them got to minus 5.21 percent or better. November 2015 to October 2016, minus 14.03 percent. July 2024 to July 2025, minus 6.15 percent. Two out of sixteen. That is the number worth writing on the chart.
The near-high condition and its five real samples
You can tighten the condition. Restrict the windows to those that started within 3 percent of the trailing twelve-month high — roughly where we are, 3.4 percent below July record close — and the hit rate rises to 16.7 percent across 1,431 windows, against 4.0 percent for everything else. The median outcome barely moves: +3.19 percent versus +3.76 percent.
Now the deflating part. Those 1,431 overlapping windows contain five independent episodes. Their outcomes were +23.8, +14.4, +3.6, minus 4.7 and +21.2 percent. One of five went the right way, and none of the five reached minus 5.21 percent. The conditional base rate looks twice as good and rests on five observations, four of which argue against you.
There is a regime problem too. Split the sample at 2022 and the recent half is worse for the short, not better. Windows starting from 2022 have a median of +5.05 percent and only 7.0 percent ended 5.21 percent lower, against +2.16 percent and 10.2 percent before. Yen weakness has been the dominant regime, and base rates do not predict regime breaks — they describe the one you are already in.
The level gets visited four times more than it gets lived in
Ending at 150 and trading at 150 are different events, and the gap between them is the most useful thing in this whole exercise.
Across the same windows, 40.9 percent traded 5.21 percent or more below their starting level at some point during the year, with a median of 62 trading days to the touch. Only 9.4 percent were still there on day 252. In 31.6 percent of windows the level was reached and then left behind.
For a CFD trader that is a structural choice, not a footnote. A resting limit at 150 gets filled in roughly four years out of ten; a position held to the twelve-month mark collects in one out of ten. If your plan is the second one, you are not trading the target at all — you are trading whether the yen keeps weakening.
The path is worse than the destination
Short USD/JPY and the thing that ends you is not a slow grind. It is the pair going up.
Over a 252-day window the median worst adverse close against a short is +7.49 percent; the ninetieth percentile is +22.98 percent and the worst case in the sample is +33.04 percent.
Hold that against the target. The median year for a short USD/JPY position shows a paper loss of 7.5 percent at some point, which is larger than the 5.21 percent you are trying to collect. The shorter windows bite too: across any 21 sessions the median worst excursion against the short is 1.59 percent, and one in ten goes past 4.64 percent.
And it arrives in single sessions. The biggest one-day jumps since 2011 are +3.82 percent on 4 April 2013, +3.39 percent on 1 November 2011 and +3.32 percent on 3 November 2014 — every one of them a policy or intervention day. Around 4 percent of all sessions move a full percent or more in either direction.
Half the move is the ticket price
Now the part that decides whether the trade is worth taking at all.
A twelve-month FX target is a price forecast, not a return forecast. The difference between the two is the carry, and on a currency pair held for a year the carry is not a rounding error.
The US three-month bill yield was 4.23 percent on 8 October (FRED DGS3MO). Japan three-month interbank rate was 1.458 percent in July, the latest month published (FRED IR3TIB01JPM156N). The gap is 2.77 percentage points. Depending on which pair of short rates you use it lands between 2.60 and 3.08, so call it roughly 2.8.
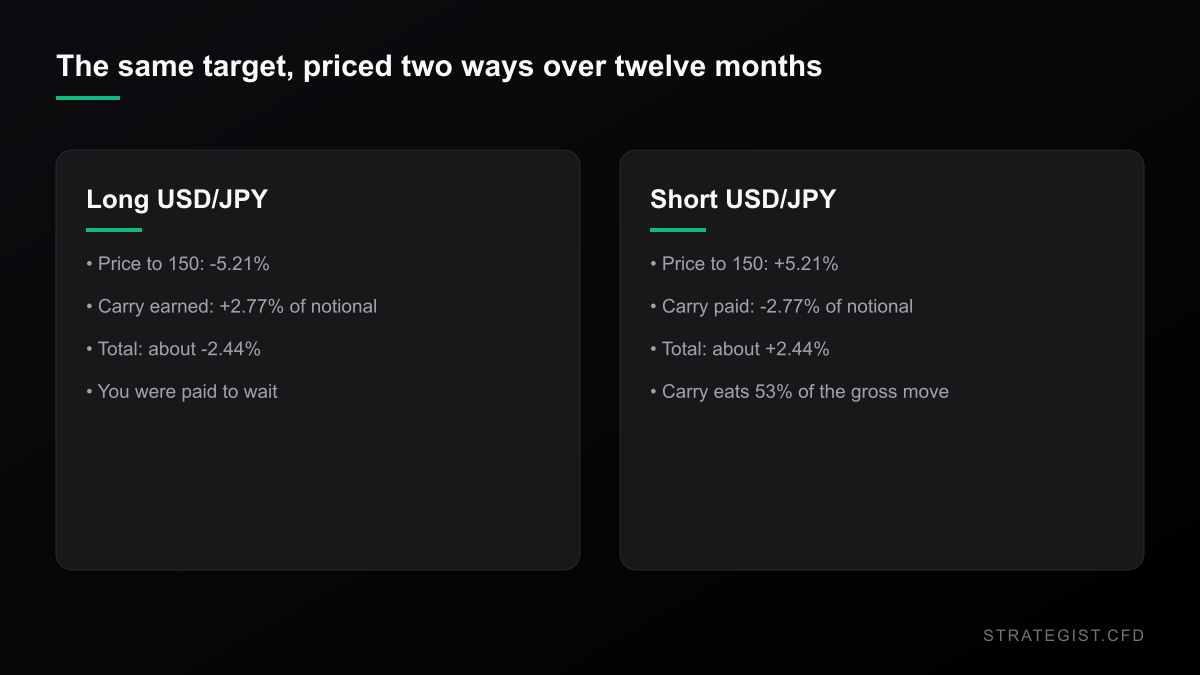
Holding a short USD/JPY position for twelve months costs about 2.77 percent of your notional. The move to 150 pays 5.21 percent. The carry eats 53 percent of the gross move before you have paid a single spread.
This cuts both ways, which is the actual point. If you are long the pair and Goldman is right about the level, you do not lose 5.21 percent. You lose about 2.44 percent, because you were paid to wait.
Your stop distance sets the carry bill
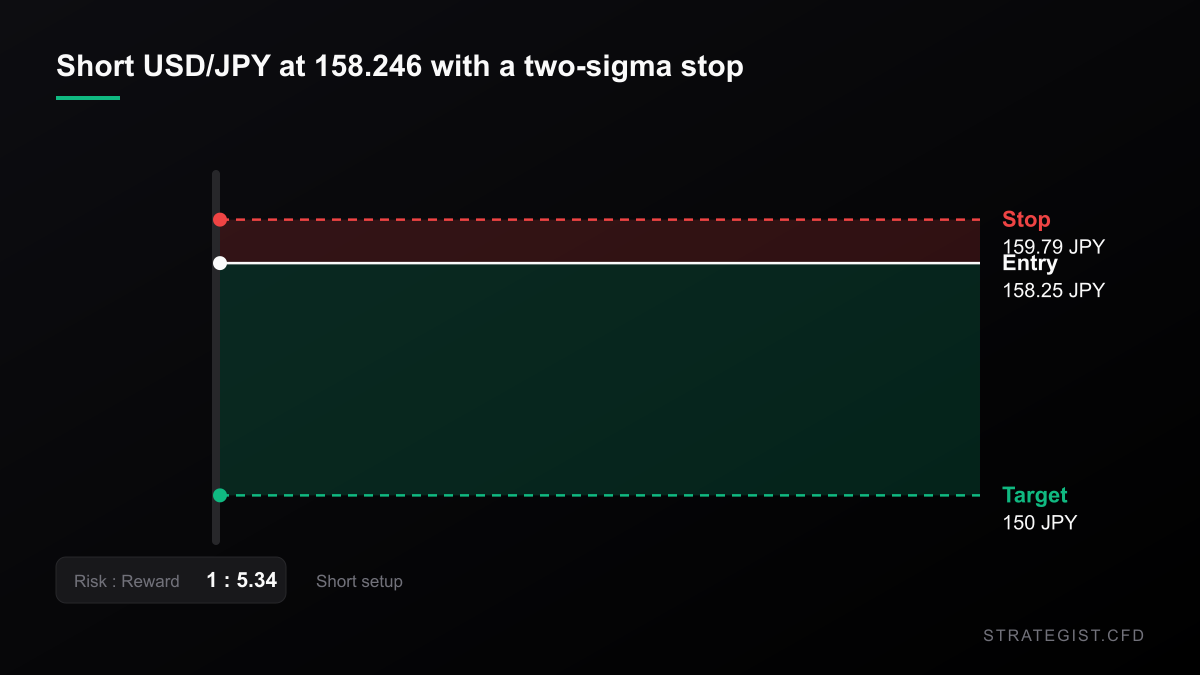
This is where CFD mechanics quietly take over the decision. Swap is charged on notional, and notional is set by how wide your stop is.
Take a 25,000 account risking 1 percent a trade, 250. A 0.25 percent stop buys 100,000 of notional, four times the account, and twelve months of carry on that is 2,770 — 11.1R. Widen the stop to 3 percent and the same 250 of risk buys 8,333 of notional, and the carry falls to 231, under one R.
The stops this tape suggests right now are tight, because the tape is quiet. Twenty-day daily volatility is 0.336 percent, about 5.3 percent annualised; 2026 realised volatility of 7.93 percent is the sixth calmest of the sixteen years in the sample. Two twenty-day sigma is a 0.67 percent stop. At that distance your 250 of risk buys 37,176 of notional, 1.49 times the account, and the carry bill for a year is 1,030 — 4.1R. The gross move to 150 is 7.75R. Net, about 3.6R, if you are never stopped out.
You will be stopped out. That 0.67 percent stop was touched in 96.2 percent of the 252-day windows in the sample, with a median of four sessions to the touch. Even a two-sigma stop measured over a full year, 0.98 percent, was hit in 94.2 percent of windows, median eight sessions. A 3 percent stop still gets touched in 80.2 percent of years, median 42 sessions.
How this is wrong
The carry arithmetic assumes the differential stays where it is, and that is the softest input in the piece. If the BOJ keeps tightening, the gap narrows and the yen strengthens at the same time: the carry bill shrinks while the price move works in your favour. The two effects that currently halve your edge would reverse together — and BOJ tightening is Goldman stated reason for the cut.
The 2.77 percent is also an interbank differential, not your swap. Retail CFD swaps are quoted after a broker markup, are frequently a debit in both directions, and are usually charged triple on Wednesday to cover the weekend. Your real number is in your platform swap table, and it will be worse than mine.
And the base-rate exercise rests on sixteen independent observations, two of which reached the target. Enough to say the move is uncommon; nowhere near enough to say it is unlikely in the year a central bank is normalising.
What to do with it
- Price the trade in total return, not in price. Target move minus months of carry, divided by your stop distance. A 5.2 percent target over twelve months is a 2.4 percent trade before costs.
- Decide whether you want the level or the holding period. A limit at 150 has roughly a 41 percent chance of being touched inside a year; holding to the date has a 9.4 percent chance of finishing there. Different trades, different sizing.
- Size from the carry you can live with, not from the tightest stop your platform allows. On a multi-month FX position the stop distance is a financing decision as much as a risk decision.
- Assume the median path against you is 7.5 percent. If the account cannot sit through that on the notional you picked, the target is irrelevant.
- Treat the revision history as information. A target that moved 9.1 percent in eighty days is not a precise level.
Risk Analyzer
Quantify event-specific risks and calculate potential impact on your portfolio.
The 10-Year Is at a 2007 High. The Carry Is the Trade.
The 10-year Treasury closed at 5.184%, the highest since July 2007 — and the S&P still finished the week up 1.21% with the VIX under 15. The stock-bond correlation has flipped sign since 2007, and the part of that which is not a forecast is the carry: it eats a forex setup's 0.6R target in about thirteen days.
Two Hikes in Four Days: Inside the USD/JPY Trap
The Fed decides Wednesday, the BOJ follows later in the week, and the yen is already sitting near a seven-month high. Here is how CFD traders should size it, hedge it, or just stay out of the way.
Method note. Yahoo Finance daily bars for USD/JPY, 3 January 2011 to 9 October 2026, 4,106 sessions. Pre-2011 is excluded because the 2008 series carries bad prints, including a 17.7 percent one-day jump on 8 December 2008 that fully reverses the next session. Forward windows run 252 trading days from each close and overlap; independent samples are non-overlapping blocks of 252. Adverse excursion uses intraday highs. Carry uses FRED DGS3MO and IR3TIB01JPM156N plus Yahoo ^IRX. Swap markups, spreads and slippage excluded. One-off scripts under .workbuddy-ai/tmp/, not the site backtest engine.
Charts and analysis on this site are for research only and are not investment advice.
More in News
 News2026-10-31
The Nasdaq Just Entered Its Third Correction of 2026. The Closing Price Disagrees.
Three ways to measure Friday's drawdown give -9.09%, -10.03% and -10.42%. Which one your broker uses decides whether you survived it.
 News2026-10-31
The S&P Lost 1.82% on Friday. 64% of It Was Priced Before the Bell.
Semis fell 6.98%, the S&P 1.82%, and most of the move was an overnight gap. What the split between the gap and the session says about stop placement, fills and the one trade Friday actually set up.
 News2026-10-17
Oil Hit $110 and the Nasdaq Had Its Worst Week in 18 Months. That Pair Has No Precedent.
Brent closed at $109.86 on Friday and WTI gained 10.41% on the week. The Nasdaq 100 fell 5.49% over the same five sessions. In 1,084 weeks of data that pairing has never happened — here is what it means for a leveraged book.