Ether's Two Published Targets Are 1.98x Apart. Only One Has a Base Rate.
Tuesday's close, and Wednesday's slide
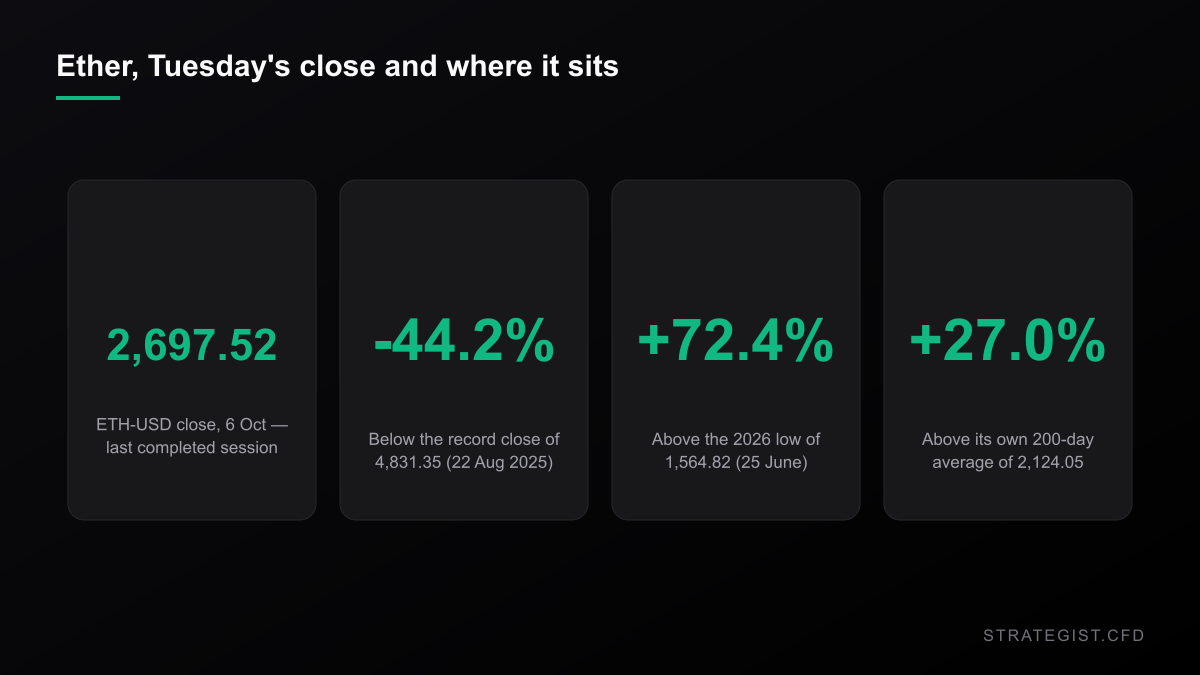
Ether closed at $2,697.52 on Tuesday. By Wednesday afternoon it was nearer $2,569, under the round number, after US spot ether ETFs logged $201.9m of net redemptions — the sixth session in a row. Bitcoin traded below $84,000 on the same tape, and crypto venues reported somewhere near $500m of liquidations.
The week also produced two price targets. Citi put ether at $3,028. VanEck put it at $6,000. They ran in the same story, and the spread between them is 1.98x. That gap is the part worth examining, because a 1.98x spread isn't a forecast — it's two desks describing two different assets that happen to share a ticker.
Some context on where $2,697.52 actually sits. It's 44.2% below the record close of $4,831.35 from 22 August 2025. It's 72.4% above the 2026 low of $1,564.82 printed on 25 June. And it's 27.0% above its own 200-day average. That combination — far below the record, well above the trend — is what a violent recovery looks like three months in: ether is up 44.4% over 63 sessions and still down 10.7% over 252.
What each target is actually asking for
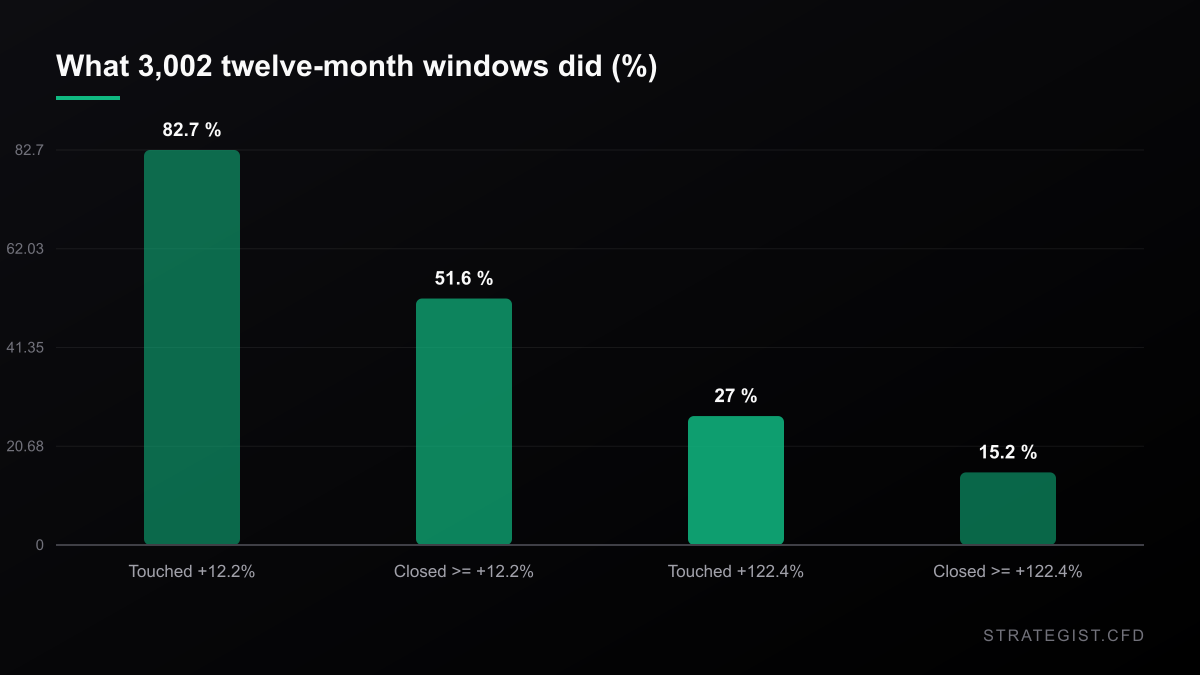
From Tuesday's close, Citi's $3,028 is +12.2%. VanEck's $6,000 is +122.4%.
Those aren't two points on one distribution. Twelve percent is roughly what ether does in a good quarter. One hundred and twenty-two percent is roughly what ether did in 2020 and 2021, and hasn't done since.
So I measured both. ETH-USD daily closes from Yahoo Finance, 9 November 2017 through 6 October 2026 — Wednesday's bar was still forming and is excluded from every number below. Then every 252-session window in that history, 3,002 of them. For each one I asked whether ether ever traded 12.2% above the starting close at any point in the following year, and whether it actually finished there. Same question for 122.4%.
Only twelve of those years are independent
Here's the caveat that should temper everything that follows. Those 3,002 windows overlap: each session appears in 252 of them. Twelve-month windows starting one day apart aren't twelve independent observations, they're the same year viewed from a slightly different chair.
Slide the window along in non-overlapping blocks instead and nine years of data collapses into twelve numbers: +46%, −70%, +7%, +187%, +461%, +55%, −56%, +10%, +23%, +6%, +13%, −27%. That's the real sample. Two of those twelve years cleared +122.4%. Six cleared +12.2%.
So: the base rates are directionally useful and statistically thin. I'm not going to pretend 3,002 is 3,002.
The bigger target belongs to 2020
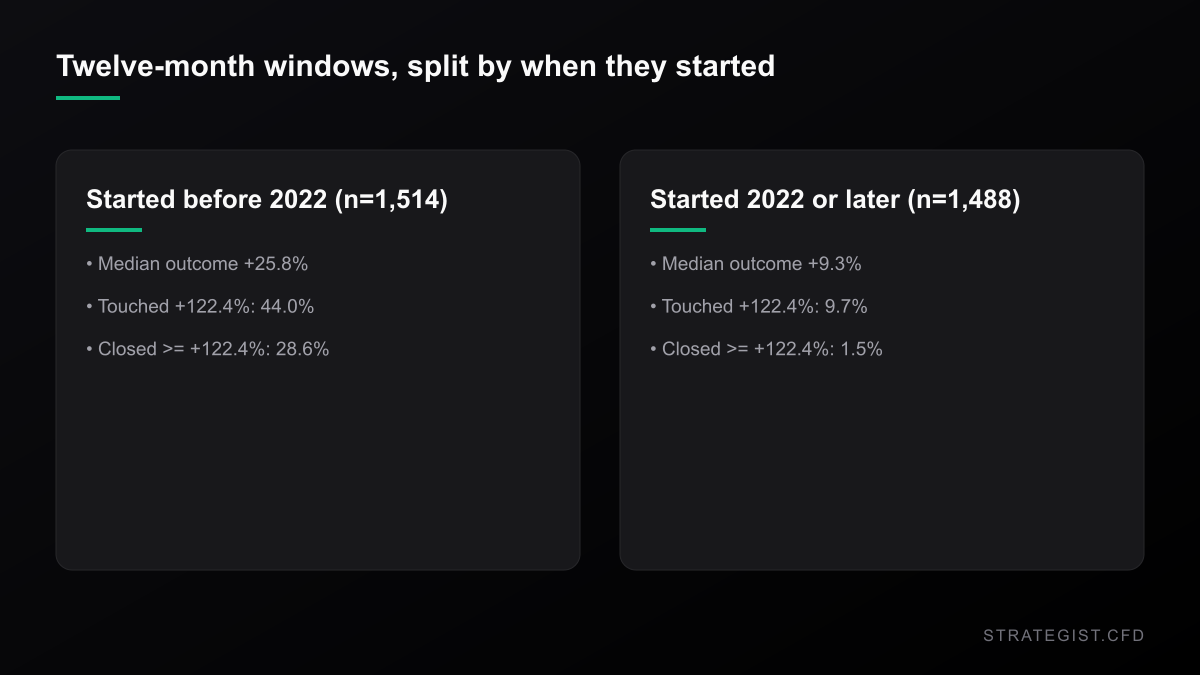
Which brings me to the distribution's actual problem. Split the windows by when they started.
Before 2022, ether's median twelve-month outcome was +25.8%, and 44.0% of windows touched +122.4% at some point. From 2022 onward the median drops to +9.3% and only 9.7% touched it. Of the 811 windows that ever got there, 82.1% started before 2022 — and 336 of them started in 2020 alone.
It also takes time when it does happen. The median run to +122.4% was 121 sessions, with the slowest quarter taking more than 158. If VanEck's number is a year-end 2026 call — the reporting I could verify doesn't pin a horizon to it — then it has roughly 60 sessions left to work with, and ether has touched +122.4% inside 63 sessions in 4.0% of its history. Since January 2023: zero times out of 1,312 windows.
I'm not saying $6,000 can't happen. I'm saying the machinery that produced that number stopped running in 2021.
The median year costs you 32% before it pays you
This is the figure that changes how I'd hold either bet. Across those same windows, the median worst drawdown inside the year — the deepest close relative to entry, before you get to the outcome — was −32.1%. A quarter of windows went past −54.9%. The worst was −89.7%.
So the median path to a +14% year required sitting through a 32% drawdown. Citi's target is +12.2%; the median adverse excursion on the way there is nearly three times that. If you're levered, that excursion is the trade.
A two-sigma stop lasts four sessions
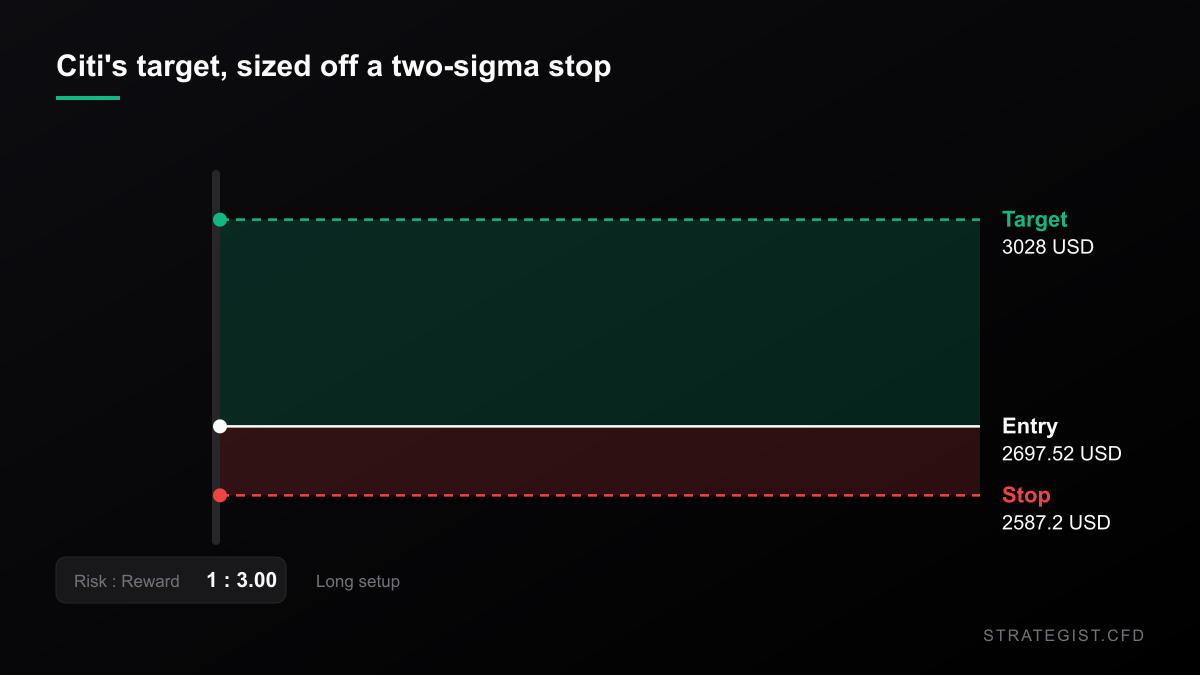
Ether's daily standard deviation over the last 20 sessions is 2.05%; over the last 252 it's 3.27%. A textbook two-sigma stop is therefore 4.09% away, or 6.55% if you use the annual figure.
I ran both against every long entry in the series. A 4.09% stop was touched within 21 sessions in 64.0% of cases, and the median time to the touch was four sessions. Stretch to 63 sessions and it's 76.4%. Widening the stop to 6.55% bought almost nothing: 53.3% within 21 sessions, 69.7% within 63.
That isn't a stop. That's a timer.
Now the sizing. On a $25,000 account with a 1% risk budget — $250 — a 4.09% stop buys $6,111 of notional. That's 0.24x. You cannot hold a one-to-one position in ether with a volatility-based stop and stay inside 1% risk; at 1x notional, $25,000, the same 4.09% adverse day costs $1,023, or 4.09% of the account in one session.
Then there's the clock. Financing at the 13-week bill (4.045% on 7 October) plus a 2% markup is 6.045% a year. At the 0.24x size, burning one R takes about eight months. At 1x it takes two. A twelve-month target held at 1x pays roughly six R in financing before it pays you anything at all.
Ether stopped trading on ether
One more reason to treat both targets as a single bet. Over the last 252 sessions ether's correlation with bitcoin is 0.911, up from 0.782 across the full history, and its beta to bitcoin has risen from 1.01 to 1.21. The two closed in the same direction on 86.1% of sessions over the past year. Ether's daily standard deviation is 3.27% against bitcoin's 2.46%.
Read that plainly: on this tape ether is bitcoin with 1.33x the volatility and a 1.21 beta. Both published ether targets are, in large part, a bitcoin call wearing an ether badge. Citi's bitcoin target in the same week was $113,000, against a price under $84,000 on Wednesday. If you already carry bitcoin exposure, an ether long is not diversification — run it through the
Correlation Matrix
Analyze the statistical relationship between different assets to avoid over-exposure.
What to actually do with two targets 1.98x apart
- Separate the horizon from the number. A target without a date is a marketing artifact. If it's a year-end call, the base rate for +122.4% inside 63 sessions is 4.0% — and zero since 2023.
- Size for the excursion, not the target. A median −32.1% drawdown inside the year means the stop decides whether you're still in the trade, not the exit.
- Accept that 1% risk on crypto is a small position by construction. 0.24x notional is what the arithmetic gives you; that's a feature, not a problem to fix with a tighter stop.
- Price the clock before the horizon. Six R a year at 1x is more than most twelve-month targets are worth.
- If you want the exposure without the twelve-month carry, say so out loud —
Risk Analyzer
Quantify event-specific risks and calculate potential impact on your portfolio.
Where I could be wrong
Three ways, and the first one matters most. Base rates on an asset with nine years of history and one regime change are close to anecdote. If 2026 really is a fresh adoption cycle, then the post-2022 subsample is the wrong prior and everything above is measuring a world that already ended. Second, I measured close-to-close moves on Yahoo's ETH-USD series, which carries no funding, no spread, and none of the mechanics of a CFD that merely tracks that price — my stop-touch figures are what the underlying did, not what your broker would have filled you at. Third, I've treated both targets as twelve-month numbers because that's the horizon the comparison needs; if VanEck's is longer-dated, these base rates understate it, and if Citi's is a quarter-end call, +12.2% is easier than 51.6% suggests.
Related reading:
Bitcoin Reclaimed $80,000 on a Rule Nobody Has Read
The CFTC's crypto filing reached the White House with no published text and no deadline. Bitcoin still jumped 5.9% on Friday. Here's what the filing says, what it doesn't, and how to size around it.
Charts and analysis on this site are for research only and are not investment advice.
More in News
 News2026-10-31
The Nasdaq Just Entered Its Third Correction of 2026. The Closing Price Disagrees.
Three ways to measure Friday's drawdown give -9.09%, -10.03% and -10.42%. Which one your broker uses decides whether you survived it.
 News2026-10-31
The S&P Lost 1.82% on Friday. 64% of It Was Priced Before the Bell.
Semis fell 6.98%, the S&P 1.82%, and most of the move was an overnight gap. What the split between the gap and the session says about stop placement, fills and the one trade Friday actually set up.
 News2026-10-17
Oil Hit $110 and the Nasdaq Had Its Worst Week in 18 Months. That Pair Has No Precedent.
Brent closed at $109.86 on Friday and WTI gained 10.41% on the week. The Nasdaq 100 fell 5.49% over the same five sessions. In 1,084 weeks of data that pairing has never happened — here is what it means for a leveraged book.