The S&P 500 Is at a Record. Holding It Costs More Than It Pays You.
Tuesday, in numbers
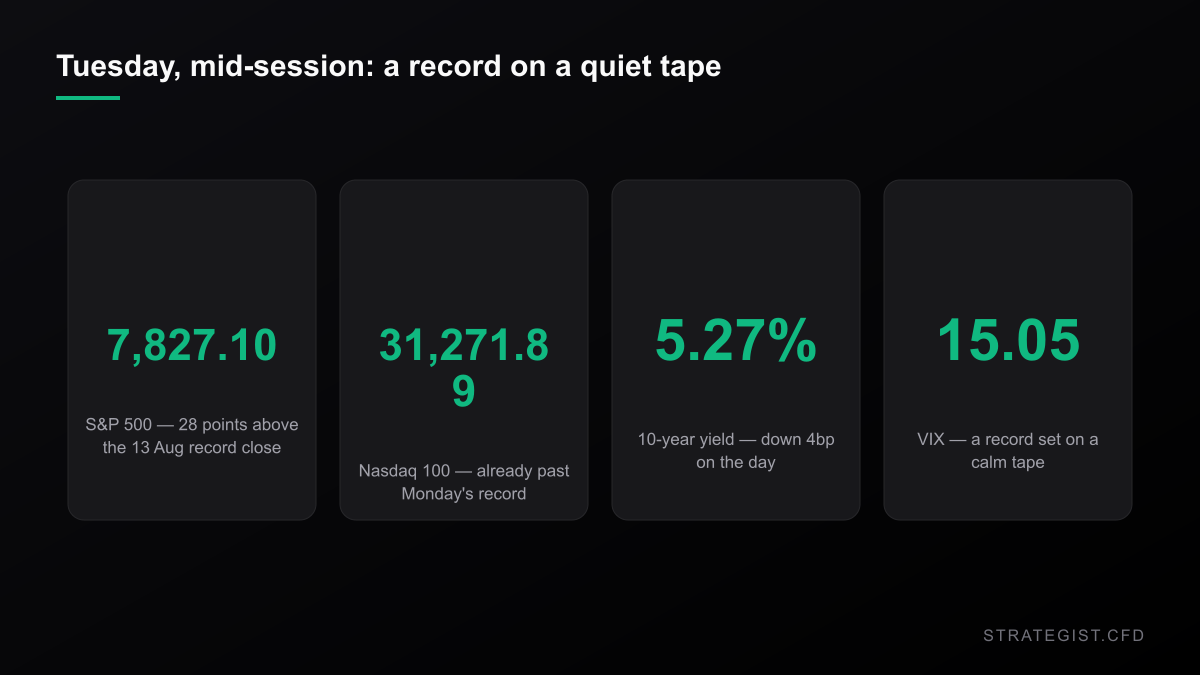
Around one in the afternoon in New York, the S&P 500 was at 7,827 — up 0.68%, and 28 points above the 7,798.99 record close it printed on 13 August. The Nasdaq 100 was at 31,272, already 195 points past Monday's record with half the session left. The Dow was up 273 points, and still further from its own high than either of them: it closed Monday 5.7% below the 54,349.12 record it set on 5 August.
Three indices, three completely different distances from their own highs. The headline says "records". The tape says two of them are, and one of them isn't close. If you hold a US30 CFD and read that the market is at an all-time high, you are holding something that has been in a drawdown for two months.
The rest of the picture was quiet. The 10-year was at 5.27%, down four basis points on the day. The VIX at 15.05. WTI at 89.36, near unchanged. Nvidia's market cap crossed $5.8 trillion mid-session and its 52-week high is Tuesday's own high. This was not a euphoric record. It was a record set while nothing much happened.
A record set on the calmest kind of tape
The twenty-session standard deviation of daily S&P returns is 0.663%. Against every rolling twenty-day window since 2015, that is the 36th percentile; the median is 0.774%. Volatility is not just low in absolute terms — it is low relative to a stretch that already contains a pandemic and the fastest tightening cycle in forty years.
That matters for one specific reason: volatility clusters, and it clusters in the direction you might not expect. When the trailing twenty-day standard deviation sits in the calmest quartile, the following twenty sessions come in at a median of 0.607%. When it sits in the wildest quartile, the next twenty run at 1.315% — 2.17 times wider. Calm tends to hand you more calm.
Do not read that as safety. Even from a calm starting point, the median worst single session over the next twenty is 1.42%, and the median worst session after a wild stretch is 2.91%. One ordinary bad afternoon in a quiet month is still more than twice today's daily standard deviation. A stop calibrated to the calm is calibrated to a tape that has a habit of producing days bigger than the stop.
What the index pays you, and what it costs to hold it
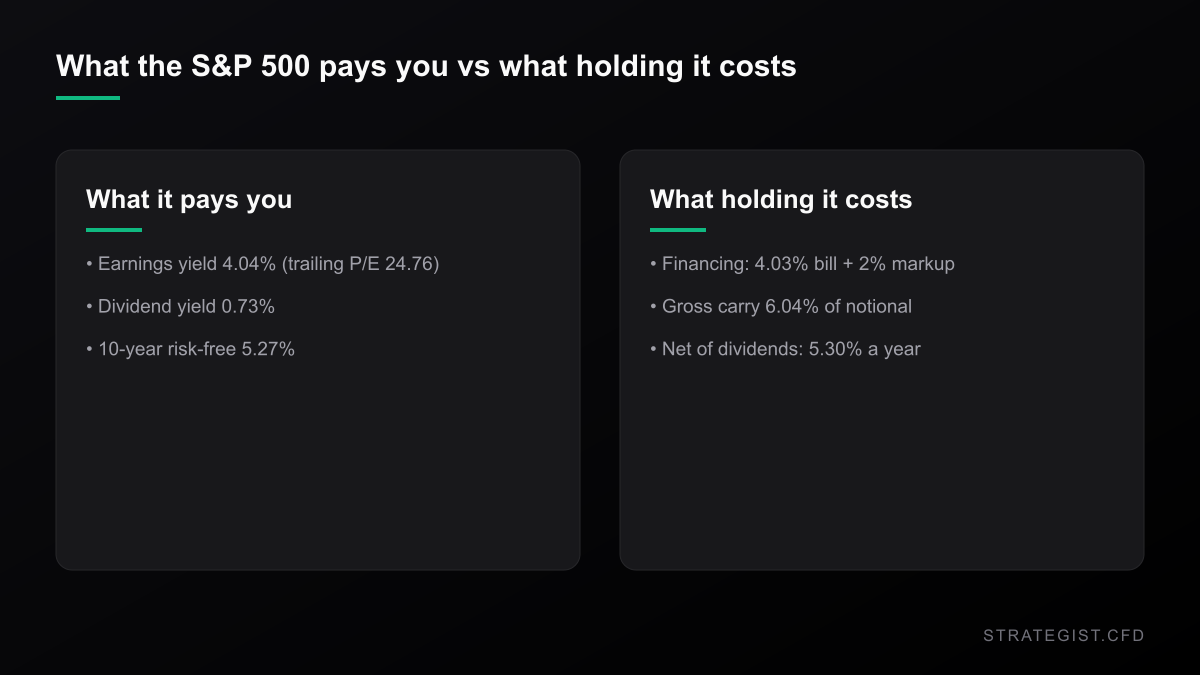
SPY's trailing price-to-earnings is 24.76. Invert it and the index throws off an earnings yield of 4.04%. The 10-year is 5.27%. On trailing earnings, equities are yielding 1.23 percentage points less than a risk-free bond.
That comparison — the so-called Fed model — has real defects, and I'll get to them. But a CFD trader doesn't pay a valuation ratio. What you pay is a financing line, and that line is not a matter of opinion.
Broker financing on an index CFD is normally a short benchmark rate plus a markup. The 13-week Treasury bill is 4.035%. Add a 2% markup — typical for retail, and yours may be higher or lower — and you are paying 6.04% a year on the notional. SPY's trailing dividend yield is 0.73%, and most brokers credit dividends back to a long holder. Net of that, call it 5.30% a year.
So the three numbers that matter sit in a row: 4.04% earnings yield, 0.73% cash in your pocket, 5.30% carry out of it. You are paying more to hold the thing than the thing earns. And 5.27% on the 10-year is not an ordinary level to be measuring against — it has closed at or above that on exactly three sessions since 2010, all of them in the last six: 30 September, 2 October and 5 October.
A record high is not a buy signal
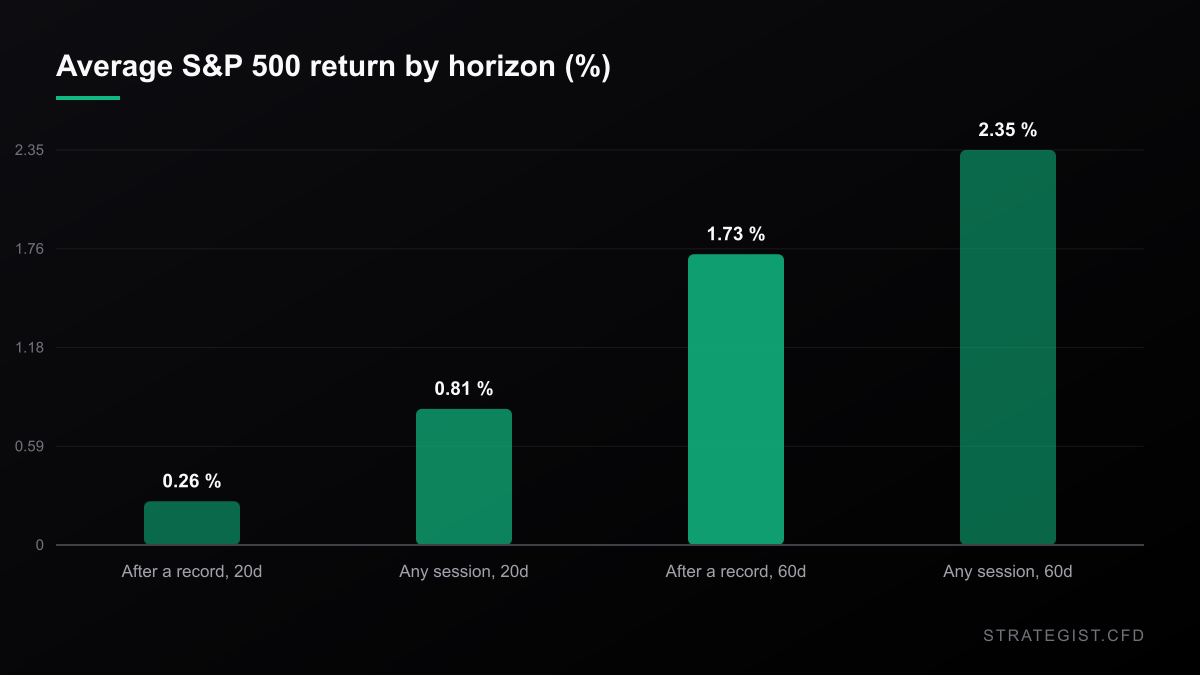
I pulled every 252-session closing high in the S&P 500 since 1990 — 1,038 of them out of 9,226 aligned sessions — and measured what happened next against the unconditional baseline for every session in the same window.
Over the following twenty sessions, the average return after a record was 0.26%. On an average day it was 0.81%. Over sixty sessions: 1.73% after a record, against 2.35% for everything. The hit rate tells a slightly different story — 72.1% of records were higher sixty sessions later, against 70.6% unconditionally. Records are not bearish. They are just a modestly worse-than-average place to put on a directional bet that is modestly more likely to be green.
There is one bucket where records beat the baseline, and it's the bucket today's tape sits in: sessions where the 10-year was already above 5%. Sixty sessions later those returned 2.81%, against 1.90% for all high-yield sessions. I am not building anything on it. Of those 305 observations, 296 come from the 1990s and not one of them is from 2010 or later. In 1996 a 5% ten-year meant disinflation from a much higher base. In 2026 it means something else entirely, and my sample can't tell you what.
The stop that fits today gets run over
Two standard deviations of twenty-day volatility is 1.33%. Put a stop there the day after a record high and it gets touched within sixty-three sessions 69.0% of the time — in a median of nine trading days. Push it out to three sigma, 1.99%, and it is still hit 60.4% of the time.
The move that hurts isn't the one that stops you out. Median maximum adverse excursion over the next sixty-three sessions is −2.75%, and the tenth percentile is −8.45%. That low arrives fast: the median trough is 21 sessions in, which is to say about a month.
Compare that to doing nothing at all, which is where it gets uncomfortable.
Three months of financing costs one full R
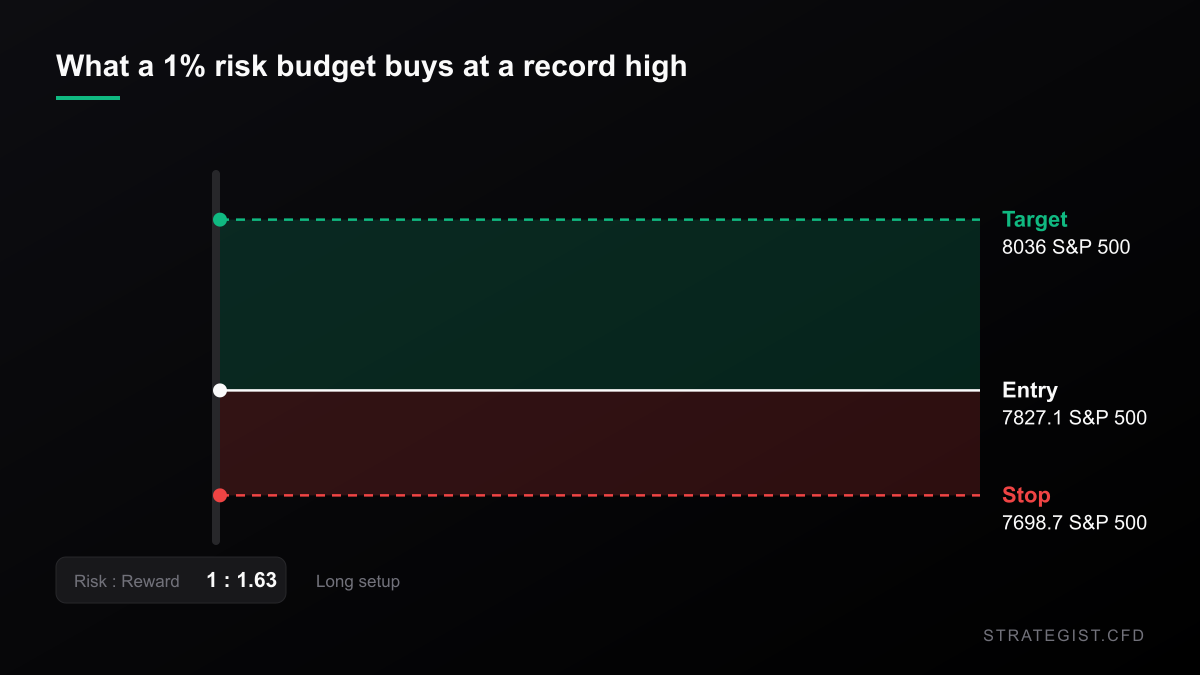
Take a $25,000 account and a 1% risk budget — $250. At a 1.33% stop that buys $18,857 of notional, 0.75 times your equity. At a 1.64% stop, which is two standard deviations of the last 252 sessions and a more honest setting for a hold measured in months, it buys $15,260 — 0.61 times. You cannot take a leveraged long here inside a 1% risk budget. The budget won't let you.
Now run the financing on that position. Net 5.30% a year on $18,857 is $999. Over sixty-three sessions — a quarter — that is $250. Your entire risk unit, gone, with the index exactly where it started.
Or look at it from the index's side. To break even over two months the S&P has to gain 1.26% before you're ahead. Its median sixty-session gain after a record is 2.67%. Financing takes roughly half of it, every time, before a single tick of adverse movement.
Leverage doesn't change the ratio. It changes the clock. At 5 times notional the same carry is 26.5% of your equity a year, and the index needs to be up more than 5% in twelve months before you have made anything at all.
Where I could be wrong
Three places, at least. The earnings-yield comparison uses trailing earnings for a cap-weighted basket whose largest members have forward multiples well below their trailing ones — Nvidia's forward P/E is 15.21 against a trailing 30.39, and a handful of names like that distort the aggregate. The Fed model has a long history of failing as a timing tool; it is a description of relative value, not a forecast.
The financing arithmetic depends on your broker. Some charge less than a 2% markup, some more, and some debit rather than credit the dividend on index CFDs, in which case your net cost is the full 6.04%. Check your own contract before you use my number.
And the event study has the usual problems: overlapping windows, so the effective sample is smaller than 1,038 makes it sound; no costs, no slippage, no gap fills; and the definition of "record" is a closing one, so intraday highs — Tuesday's 7,844.52, for instance — don't count until they hold into the close.
What to actually do with this
None of the above says sell. It says the instrument you choose is doing as much damage as the direction you pick.
- Find your financing rate before your entry. Benchmark plus markup, and whether dividends are credited. That single number is a fixed cost that runs whether you're right or wrong.
- Size off the longer volatility window. One percent of risk at 2×20-day sigma buys 0.75x; at 2×252-day sigma it buys 0.61x. The tighter number flatters you on a calm tape and then gets run over 69% of the time in three months.
- Give the trade a deadline. Three months of carry equals one full R. If your thesis needs longer than that to work, a CFD is the wrong wrapper for it.
- Check which index you're actually long. "The market is at a record" was true for the S&P and the Nasdaq 100 on Tuesday and false for the Dow by 5.7%. Those are different positions.
- Stop treating the record as information. Sixty sessions out, a record high produced a lower average return than a random day. It raises the hit rate by 1.5 points and lowers the mean. Neither is an edge.
The record is real, the tape is calm, and the carry is negative. Two of those three are reasons people add size. Only one of them is a number you can check.
Risk Analyzer
Quantify event-specific risks and calculate potential impact on your portfolio.
The same financing arithmetic applied to bonds is in
The 10-Year Is at a 2007 High. The Carry Is the Trade.
The 10-year Treasury closed at 5.184%, the highest since July 2007 — and the S&P still finished the week up 1.21% with the VIX under 15. The stock-bond correlation has flipped sign since 2007, and the part of that which is not a forecast is the carry: it eats a forex setup's 0.6R target in about thirteen days.
Why Position Sizing Matters More Than Entry Signals
Entry signals decide where you trade; position sizing decides whether you survive. Why capital allocation dominates entry precision in leveraged CFD markets, and how to build a sizing rule you can actually follow.
Charts and analysis on this site are for research only and are not investment advice.
More in News
 News2026-10-31
The Nasdaq Just Entered Its Third Correction of 2026. The Closing Price Disagrees.
Three ways to measure Friday's drawdown give -9.09%, -10.03% and -10.42%. Which one your broker uses decides whether you survived it.
 News2026-10-31
The S&P Lost 1.82% on Friday. 64% of It Was Priced Before the Bell.
Semis fell 6.98%, the S&P 1.82%, and most of the move was an overnight gap. What the split between the gap and the session says about stop placement, fills and the one trade Friday actually set up.
 News2026-10-17
Oil Hit $110 and the Nasdaq Had Its Worst Week in 18 Months. That Pair Has No Precedent.
Brent closed at $109.86 on Friday and WTI gained 10.41% on the week. The Nasdaq 100 fell 5.49% over the same five sessions. In 1,084 weeks of data that pairing has never happened — here is what it means for a leveraged book.