The Euro Just Made a 17-Month Low. The Level Is the Boring Part.
Monday, in numbers
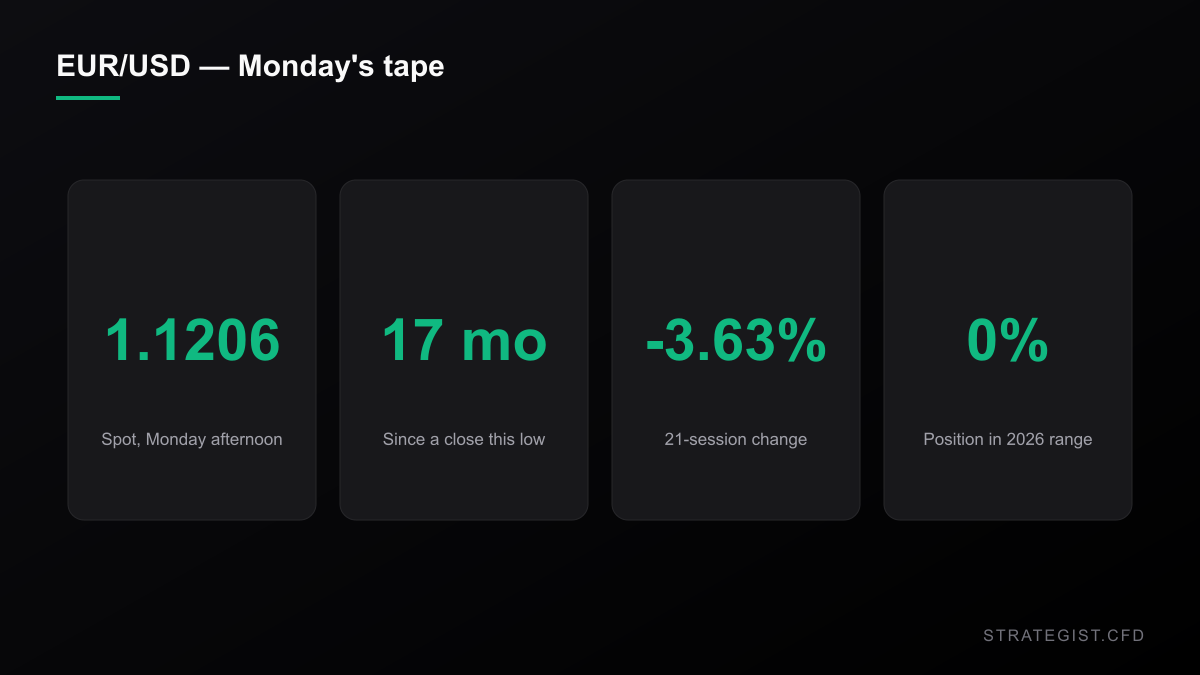
EUR/USD changed hands at 1.1206 on Monday afternoon, down 0.39% on the session, 1.51% over five sessions and 3.63% over twenty-one. That is the bottom of its 2026 range — the range runs from Monday's print up to 1.2018, and price is sitting at zero percent of it. Year to date the pair is down 4.61% after 2025 delivered 12.89%. One caveat up front: US markets were still open when I pulled this, so treat 1.1206 as a snapshot rather than a settled close.
The headline number holds up. The most recent completed close below where it traded Monday was 1.1188, on 18 May 2025 — seventeen months and 505 days ago. Reuters, CNBC, the FT, Bloomberg and the Guardian all ran it Monday with the same framing: euro at a 17-month low, dollar near its pre-“Liberation Day” highs. CNBC attributed it to political uncertainty in Spain as well as France. Reuters called France ground zero in a global bond rout last week.
Seventeen months measures time, not distance
Here is the part a headline cannot tell you. Of the 3,060 daily closes in EUR/USD since January 2015, 1.1206 is the 49.3rd percentile. It is, to within a rounding error, a median price. Since 2020 it is the 52.5th percentile. The pair bottomed at 0.9596 in September 2022, some 14% below where it is now, and spent most of 2024 under 1.05.
A 17-month low is not a low price. It is a price the market has not visited for a while. Those are two different facts, and only one of them has anything to do with your P&L.
What has actually moved is the distance from trend. The 200-day average sits at 1.1610, putting price 3.48% below it. Only 13.1% of sessions since 2015 have been that far beneath their own 200-day. That is the genuinely unusual part of this tape — not the level, the gap.
Most of the move is the dollar, not the euro
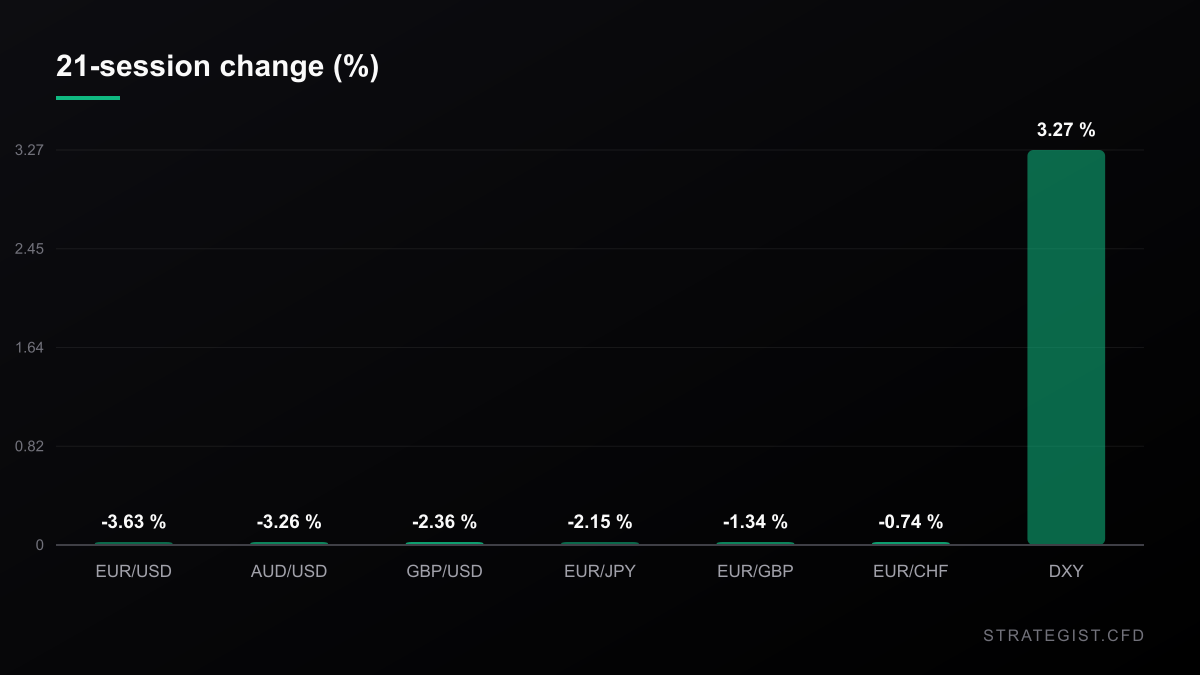
Over the same twenty-one sessions, the Australian dollar fell 3.26% against the US dollar. Sterling fell 2.36%. The dollar index rose 3.27%. EUR/USD fell 3.63%.
Three of those four moves are the same trade. A global bond selloff has the US 10-year at 5.334%, a fresh high in my data and a 24-year high according to last week's press coverage. When the long end reprices, everything quoted against the dollar gets marked down together. None of that is French.
The euro-specific piece only shows up where there is no dollar in the quote. EUR/GBP at 0.8479 sits at the 16th percentile of its five-year range. EUR/CHF at 0.9321 is at the 18th. No dollar leg in either one, and both are near five-year lows. That is the French risk premium — and it is a fraction of the size of the move you would see if EUR/USD were the only chart on your screen.
The French part shows up where the dollar isn't
The cleanest corroboration is not in FX at all. The CAC 40 is at 7,834, down 5.37% over twenty-one sessions and 10.2% below the record it set on 10 August. The DAX is 5.0% off its high, the IBEX 4.5%, the FTSE MIB 5.4%, the S&P 500 0.4%. Year to date the CAC is down 3.87% while the IBEX is up 11.51% and the MIB up 13.07%.
That matters because a weaker euro is supposed to help French equities. The CAC is loaded with exporters who invoice in dollars. If this were a competitiveness story they would be the beneficiaries. Instead they are the worst-performing large index in Europe, which tells you the market is repricing a domestic risk premium rather than handing out a currency tailwind.
Underneath it, the 10-year OAT–Bund spread crossed 100bp on 18 September for the first time since 2012 and was quoted at 146.9bp on 2 October — roughly 47bp of widening in a fortnight, in the sovereign spread of the euro area's second-largest economy. Fitch cut France to A+ in September 2025; Moody's has carried a negative outlook since October of that year.
What a one-year low actually does next
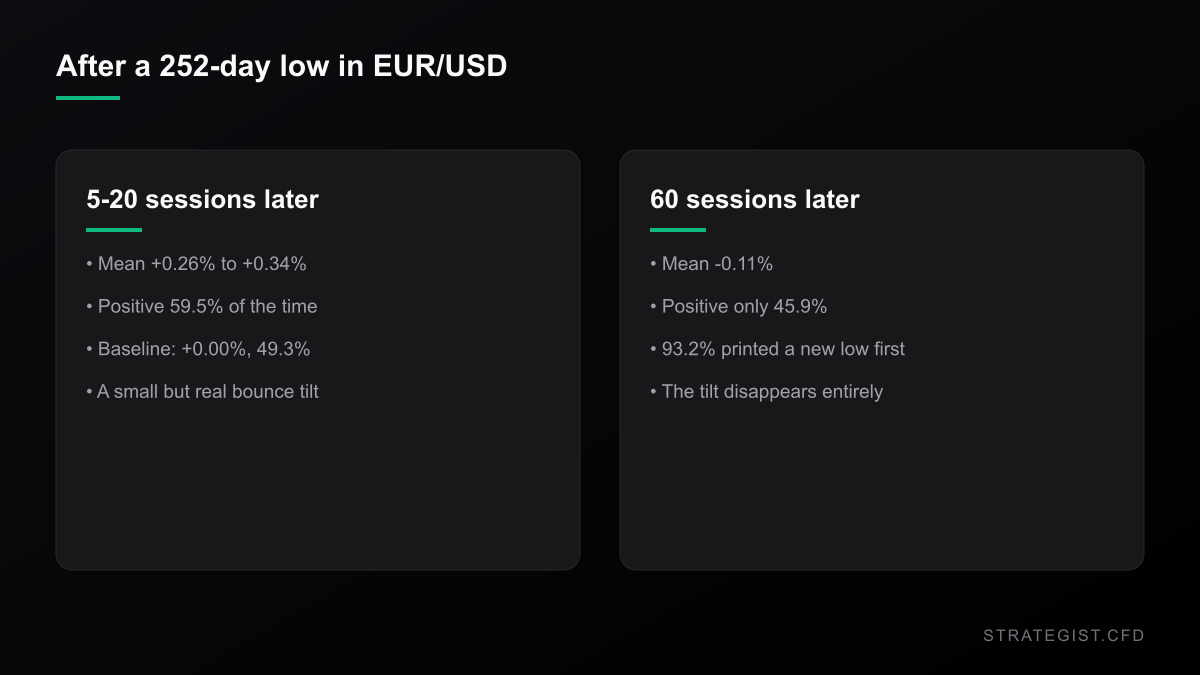
I did not want to guess at this, so I counted it. Since 2019 there have been 77 sessions where EUR/USD closed at a 252-day low. Here is what followed.
- Five sessions later: mean +0.26%, positive 59.5% of the time. The unconditional baseline across the same sample is 0.00% and 49.3%.
- Twenty sessions later: mean +0.34%, positive 59.5%, against a baseline of +0.02% and 47.6%.
- Sixty sessions later: mean −0.11%, positive 45.9%, against a baseline of +0.09% and 47.1%.
So there is a modest bounce tilt over the first month and then nothing at all. The tilt is a quarter of one percent, and it is not stable across regimes: in the 2020–2022 bucket, which holds 53 of the 77 events, the sixty-day mean was −0.56% with only 34% of windows positive.
The number I actually care about is a different one. Of the 74 events with sixty sessions of follow-through, 69 printed another new 252-day low inside that window — 93.2%. A one-year low in this pair is not a bottom. It is a waypoint.
The tape is quiet while the story is loud
This is the part that should change how you trade Monday, and it is invisible in every headline.
EUR/USD's twenty-day standard deviation of daily returns is 0.235%. The 252-day figure is 0.344%; the figure for the whole sample since 2015 is 0.490%. Median absolute daily move: 0.278%.
Across 2026 so far, 14.2% of sessions have moved half a percent or more. The long-run share is 25.0%. Only 2019 was quieter, at 11.2%. In 2022 it was 39.2%.
A compressing range with a loud narrative bolted onto it is the classic way to end up sized wrong. Volatility-based stops shrink as the range tightens, and a fixed fractional risk rule silently converts shrinking stops into larger positions.
What that does to your size
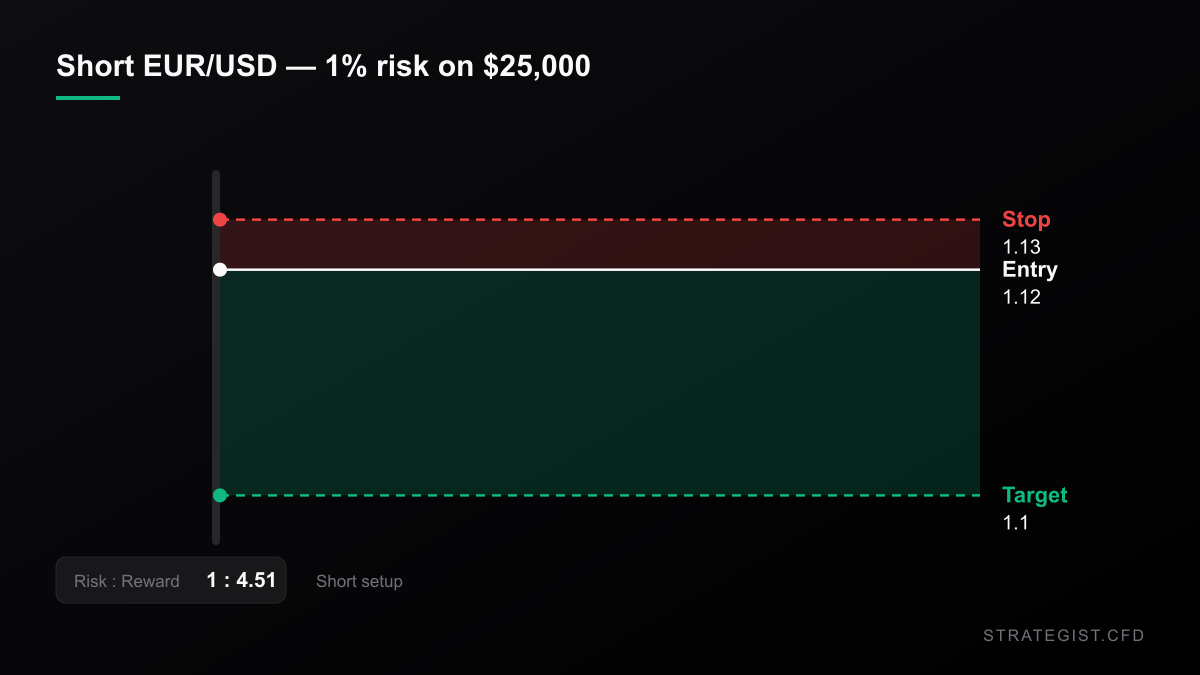
Take a $25,000 account risking 1% per trade. That is $250.
With a stop at two twenty-day sigmas — 0.470%, about 53 pips — that budget supports $53,217 of notional, or 2.13x leverage. With a stop at two 252-day sigmas — 0.688%, about 77 pips — it supports $36,315, or 1.45x. Same account, same risk rule, 47% more exposure, decided entirely by which window you measured. The mechanics behind that gap are the whole argument of why position sizing matters more than entry signals.
And the tight stop is not protection. I ran the race mechanically: from a 252-day low, with a stop 0.471% above entry and a target 2.13% below it — 2.13% being the median sixty-three-session travel — the stop was reached first in 83.7% of the 86 cases. Flip it around, buy the low with the stop beneath and the target above, and the target came first 37.2% of the time. Read those as geometry plus the mean reversion above. They are not a system: there are no costs in them, the windows overlap, and I measured which level was touched first rather than what you would actually have earned.
Weekends are the other half of the risk. Across 239 Friday-close-to-Monday-open gaps since 2015, 31.4% were larger than 0.5% and 8.4% were larger than 1%. The worst was −1.815%. A 1% gap against the 2.13x position above costs 2.1% of equity — double the budget, before the market has opened and before your stop can do anything. French fiscal news has a habit of arriving while the bond market is shut, so it is worth knowing where the
Risk Analyzer
Quantify event-specific risks and calculate potential impact on your portfolio.
How to hold this without getting picked off
- Separate the two trades. Short EUR/USD and you are mostly short the dollar against a global yield move. If you want the French premium specifically, the expression is a euro cross with no dollar leg — and it is a much smaller move.
- Size off the 252-day sigma, not the twenty-day. The twenty-day number tells you the range is tight. It does not tell you the risk is lower.
- Do not stack a short EUR/USD, a short dollar index and a short EUR/GBP and call it diversification. That is one dollar leg wearing three tickers — check it against the
Correlation Matrix
Analyze the statistical relationship between different assets to avoid over-exposure.
Where I could be wrong
Three places, at least.
The 93% figure is the one I would push back on hardest. It counts “printed a new 252-day low at some point in the next sixty sessions” — a wick deep inside a continuing downtrend counts. It does not mean you lose money holding a short; the sixty-day mean is −0.11%, which is essentially flat. It means you get stopped out repeatedly and then nothing happens. Those are different risks, and only one of them shows up in a win rate.
Second, the percentile framing cuts both ways. 1.1206 being a median price since 2015 does not make it a floor. The 2022 low was 0.9596. If the French situation keeps deteriorating there is a great deal of room underneath, and “it is an ordinary level” is a statement about the past distribution, not about where the next five hundred pips come from.
Third, I used the CAC as corroboration and it is not clean. The index carries global equity beta, its own sector mix, and a weaker currency that genuinely does help some constituents at the margin. It confirms the direction, not the magnitude. The crosses have the same problem: EUR/CHF is influenced by SNB behaviour and EUR/GBP by Britain's own fiscal mess.
The honest summary is that the most interesting thing about a 17-month low is that it is a statement about the calendar. The tradeable things — a 3.48% gap to trend, a 0.235% daily sigma, a 47% difference in notional between two stop windows — all live in the part of the data no headline prints.
Charts and analysis on this site are for research only and are not investment advice.
More in News
 News2026-10-31
The Nasdaq Just Entered Its Third Correction of 2026. The Closing Price Disagrees.
Three ways to measure Friday's drawdown give -9.09%, -10.03% and -10.42%. Which one your broker uses decides whether you survived it.
 News2026-10-31
The S&P Lost 1.82% on Friday. 64% of It Was Priced Before the Bell.
Semis fell 6.98%, the S&P 1.82%, and most of the move was an overnight gap. What the split between the gap and the session says about stop placement, fills and the one trade Friday actually set up.
 News2026-10-17
Oil Hit $110 and the Nasdaq Had Its Worst Week in 18 Months. That Pair Has No Precedent.
Brent closed at $109.86 on Friday and WTI gained 10.41% on the week. The Nasdaq 100 fell 5.49% over the same five sessions. In 1,084 weeks of data that pairing has never happened — here is what it means for a leveraged book.