Gold Is $4,162. HSBC Sees Both $4,000 and $4,750.
Friday's close, in numbers
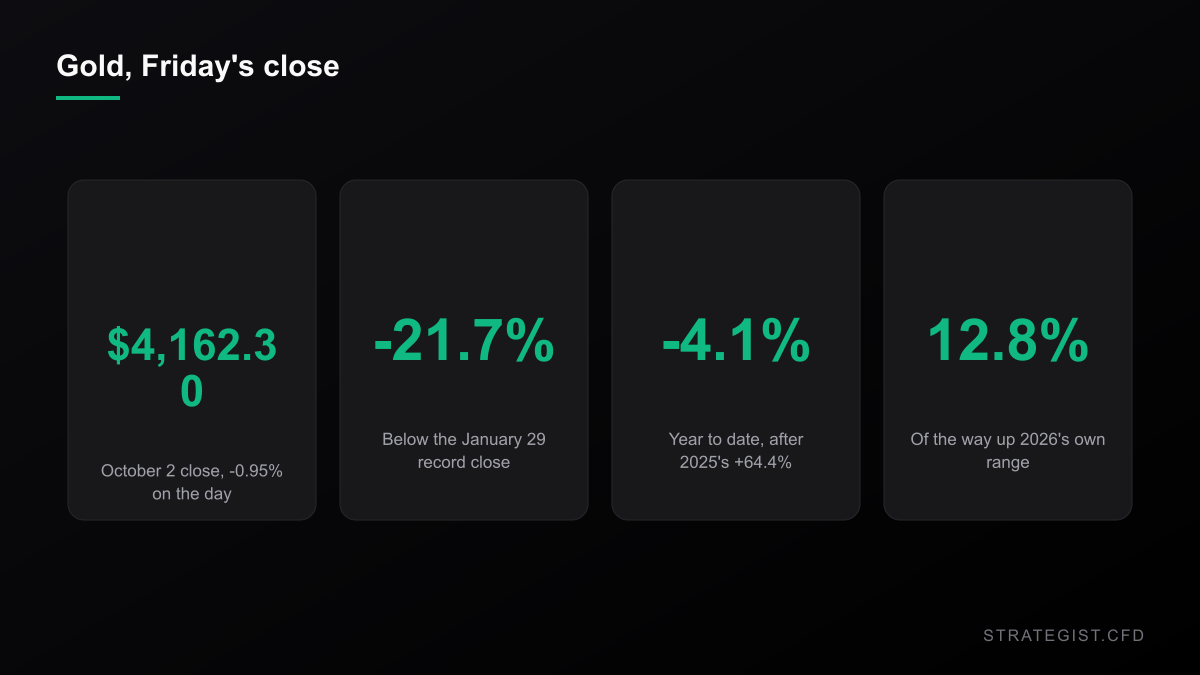
Gold settled at $4,162.30 on Friday, down 0.95% on the session and 3.68% over the last five. The payrolls report that morning was soft enough that the New York Times framed it as markets betting the Fed would skip an October increase. Equities took that well. Gold fell anyway.
The metal now sits 21.7% below its record close of $5,318.40 from January 29, and is down 4.1% on the year after 2025 delivered 64.4%. It's trading in the bottom eighth of its own 2026 range: that range runs from $3,992.10 on July 16 up to the January record, and Friday's close is 12.8% of the way up it. The 200-day moving average is at $4,553.37, which puts price 8.6% below trend.
The cuts have been chasing the price all year
None of this should surprise anyone who has watched the forecast tape. Goldman Sachs reduced its end-2026 target in mid-June. Deutsche Bank followed on June 23, cutting to $4,300 for Q3 and $4,800 for Q4 and pointing at investor demand. Bank of America trimmed its 2026 average on July 8. HSBC lowered its 2026-27 forecasts on July 9, citing a hawkish Fed tilt.
What's striking isn't that the banks cut. It's the ordering. Every one of those revisions landed after the metal had already moved. Deutsche Bank's cut came days after gold was being described as having slid back to $4,200. BofA's arrived while gold was fighting to hold $4,000. The houses weren't leading the price lower; they were writing it up on the way down.
One bank is now on both sides of an 18-point band
Which brings us to this week. On Thursday, HSBC cut its gold targets again and flagged the possibility of a retest of $4,000 in the near term. The same bank is carrying a year-end target of $4,750, set in July when it trimmed its forecast by $304.
From Friday's close, $4,000 is -3.9%. HSBC's own $4,750 is +14.1%. Deutsche Bank's Q4 number of $4,800 is +15.3%. So the gap between the cautious case and the bullish case, produced by serious institutions looking at the same metal in the same week, runs somewhere between 18 and 19 percentage points.
That's the number worth arguing about. Not which end is right — how wide the disagreement is, and what an 18-point band does to a leveraged position.
How far does gold actually travel in a quarter?
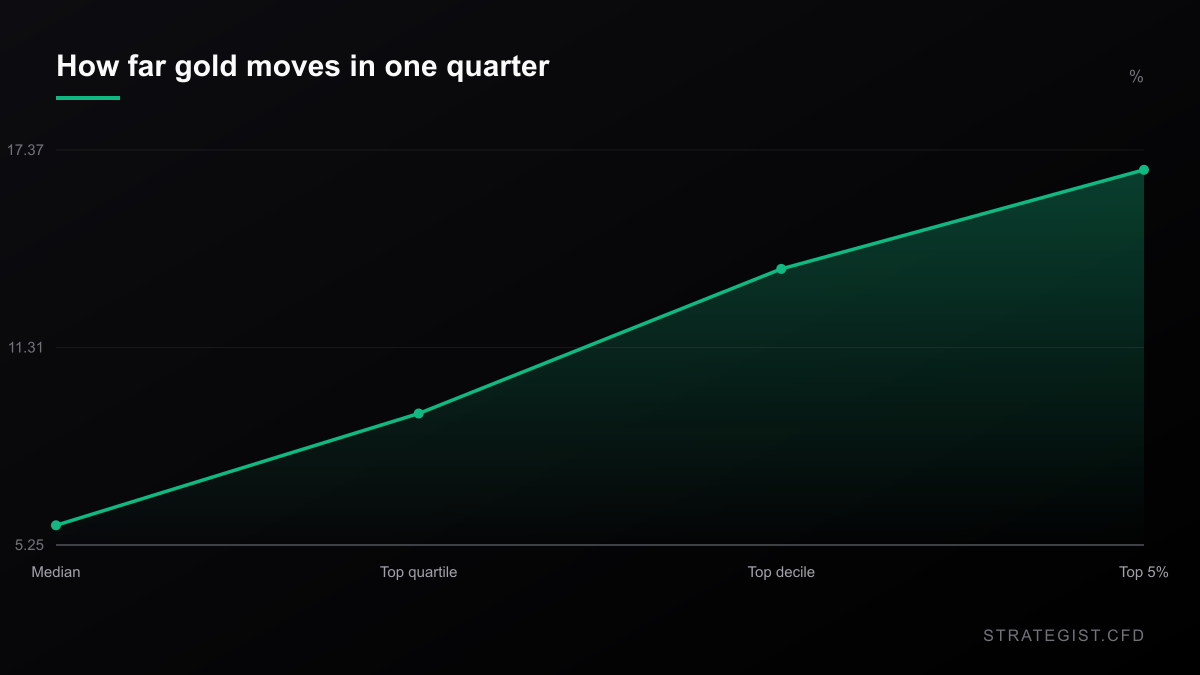
There are roughly 63 trading sessions left in the year. So "will gold finish at $4,750 or retest $4,000" is really a question about the distribution of gold's 63-day moves.
I pulled daily closes on front-month gold futures back to August 2000 — 6,548 sessions — and measured every 63-day change. The median absolute move over a quarter is 5.25%. The top quartile starts at 9.06%. The top decile is 13.99%. Only 3.5% of quarters moved 19 points or more in either direction.
Read that against the band. The houses disagree by more than gold typically travels in an entire quarter, by a factor of about 3.7. A forecast range that wide isn't a signal. It's an admission that nobody knows, printed to two decimal places.
The Gold Rule of Thumb Says $4,000. The Market Says $4,321.
Kitco's rule of thumb says a 5.18% ten-year yield should have gold well below $4,000. I ran that number against 26 years of daily bars. The slope was never stable — and gold's beta to the S&P is now +0.65, which is why the hedge stopped hedging.
What the band asks for, measured
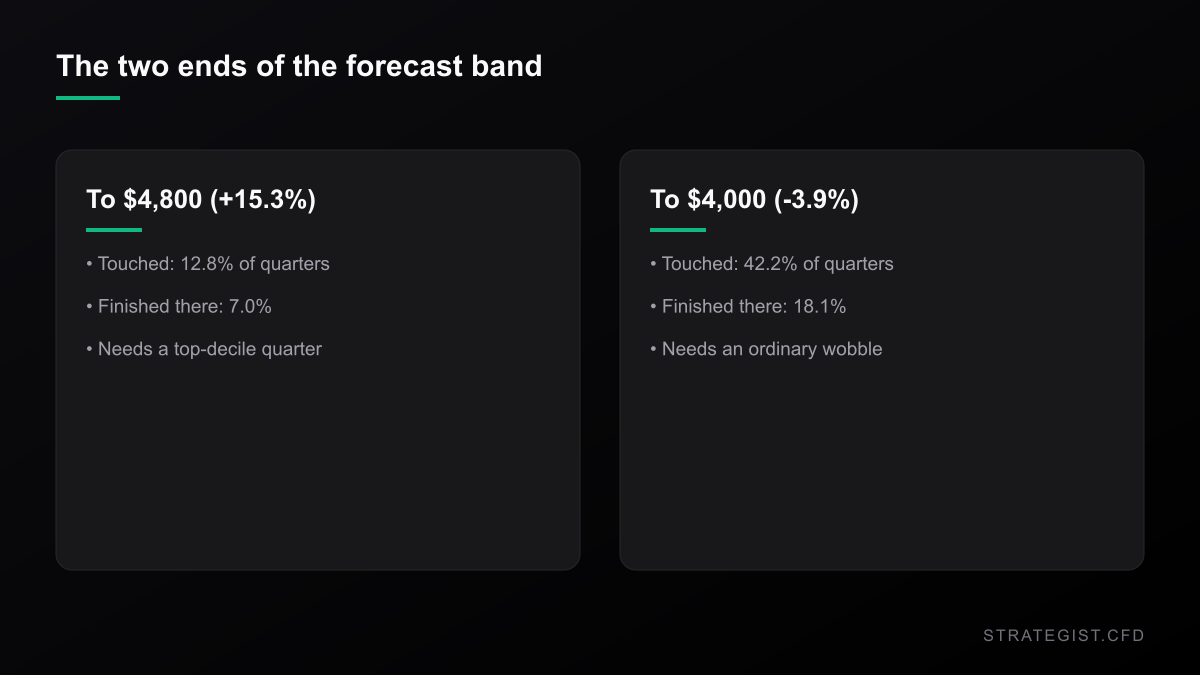
Then I ran the two scenarios directly. For every 63-day window in that sample I checked whether gold touched the level at any point, and where it actually finished. Reaching +15.3% — Deutsche Bank's $4,800 — happened at some point in 12.8% of windows, but only 7.0% of windows ended there. Falling to -3.9%, HSBC's $4,000 retest, was touched in 42.2% of windows, and 18.1% finished below it.
Two things fall out of that. The bear case is far easier than the bull case: getting to $4,000 needs an ordinary wobble, getting to $4,800 needs a top-decile quarter. And only 1.0% of windows touched both. A quarter in gold almost always commits — it goes somewhere and stays there. Which is exactly why the entry matters less than the size.
The path is what kills you, not the level
Here's the part that has nothing to do with forecasts. Over a 63-day hold, the median worst drawdown from entry — measured on closes, so it understates intraday pain — is 3.12%. A quarter of windows see worse than 6.35%. One in ten sees worse than 10.10%. The worst window in 26 years was 24.29%.
Now put leverage on it. At 5x, that median drawdown is 15.6% of your equity before your directional call has been right or wrong. A quarter of the time it's 31.8%. One time in ten it's 50.5%. You can be correct that gold finishes the year higher and still be out of the position in week three.
A "clean" stop doesn't rescue you either. Gold's 20-day daily standard deviation is 1.09% right now, so a two-sigma stop sits 2.19% away. In the same sample, a stop placed two sigma below the entry was hit within 63 days in 63.7% of windows, with a median time to stop of nine sessions. Two thirds of quarters stop you out, and half of those do it inside two weeks.
What one percent of risk actually buys
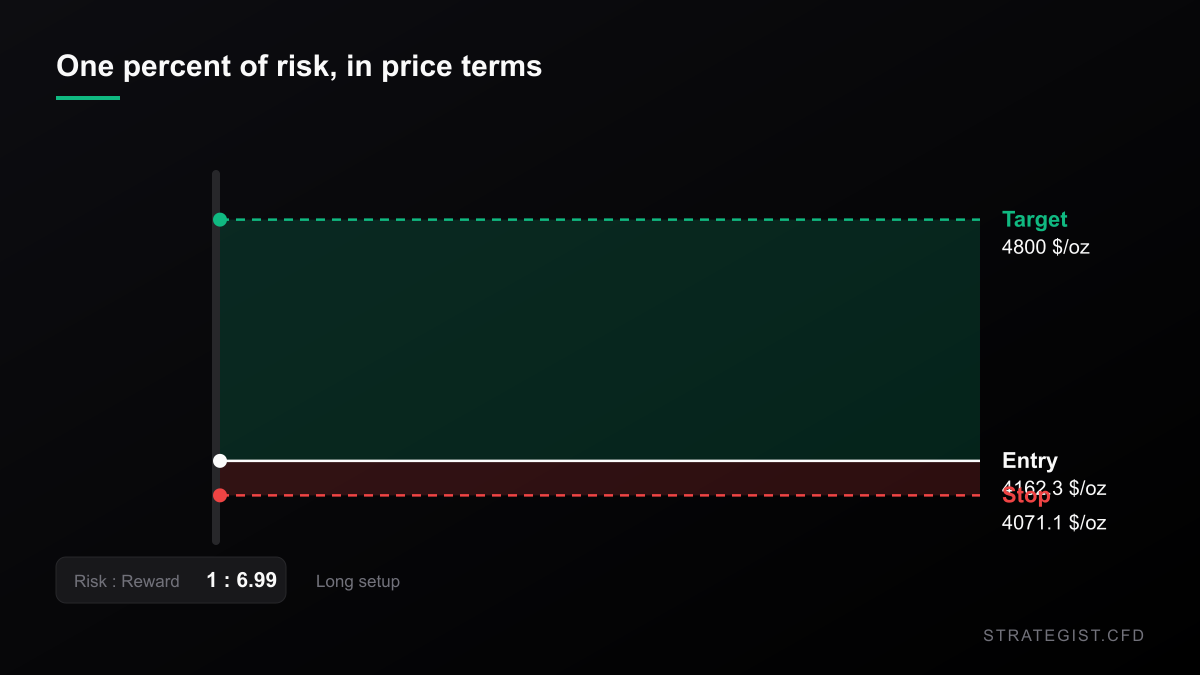
Run it backwards. On a $25,000 account, risking 1% means $250. With a 2.19% stop distance, that buys $11,442 of notional — 0.46x leverage. Not 5x. Not 10x. Less than half the account in exposure.
That's the honest reading of a market where the median quarterly wobble is a shade over 5% and the banks can't agree inside 18 points. If you still want the bull case, the geometry is a 6.99:1 payoff — entry at $4,162.30, stop at $4,071.10, target at $4,800 — and you should know going in that roughly one quarter in fourteen ends there.
The instrument matters as much as the idea. A gold CFD carries overnight financing on the full notional, so the cost of waiting three months for a target is not zero; a quarter of carry is a real deduction from a 15% move. If you'd rather see what that does to your numbers before committing, run it through the risk tool.
Risk Analyzer
Quantify event-specific risks and calculate potential impact on your portfolio.
Why Position Sizing Matters More Than Entry Signals
Entry signals decide where you trade; position sizing decides whether you survive. Why capital allocation dominates entry precision in leveraged CFD markets, and how to build a sizing rule you can actually follow.
Where I could be wrong
Several places. My windows overlap, so 6,485 observations are not 6,485 independent quarters — they're a sliding view of one history, and clusters like 2008 or 2011 get counted dozens of times. The distribution is also unconditional: it says nothing about a year when central bank buying, a fiscal shock, or an actual Fed cut shifts the regime. If 2026 is a regime change, base rates stretching back to 2000 are the wrong prior.
I can't test the sentiment piece either. Kitco's weekly survey has Wall Street on the brink of a bearish majority after Friday's slide and Main Street abandoning its bullish bias, and there's a plausible contrarian read on that — but I have no history of the survey in front of me, so I won't claim it predicts anything. Same for the arguments about gold's resilience versus the IMF calling bond markets orderly. Interesting, unmeasurable here.
And one honest tilt in the other direction: gold sitting 8.6% below its 200-day average is a rare state, only 4.6% of days since 2000 are that stretched. The forward 63-day return from that state has a median of +3.79% with 65.7% of windows positive, against an unconditional +2.85% and 64.1%. That's a real difference and it's still tiny, across 274 overlapping windows. It isn't a trade. It's a slightly warmer prior.
What to do with it
Size for the band, not for the target. If two credible houses are 18 points apart with one quarter left, the position that makes sense is the one that survives either end — which usually means smaller than feels right, and a stop that isn't parked at two sigma, because two sigma gets hit in two thirds of quarters.
Treat the forecast as a level, not a path. Touching $4,800 and finishing at $4,800 are different events with different base rates, 12.8% against 7.0%, and only the second one pays.
Finally, check the calendar. Three months of holding through payrolls, CPI and an FOMC meeting is three months of gap risk on a position you sized for a 5% quarter. If the event risk on your instrument is bigger than your stop, the stop is decorative.
Charts and analysis on this site are for research only and are not investment advice.
More in News
 News2026-10-03
29,000 Jobs, a Record Nasdaq, and a 10-Year That Refused to Fall
Payrolls missed by 55,000 and the Nasdaq 100 closed at a record. The front end priced an October hike out — and the 10-year went up anyway. Here is what that split does to a leveraged position.
 News2026-10-02
The G7 Is Releasing 100 Million Barrels. In March, 400 Million Didn't Cap the Price.
The G7 agreed to release up to 100 million barrels of diesel and crude through the IEA. In March a record 400 million didn't cap anything — WTI put on 29.5% over the following 18 sessions. What is actually tradeable here is the diesel crack, and it sits at the 98.9th percentile.
 News2026-10-01
Micron's Record Quarter Barely Moved the Stock. The Volatility Is the Story.
Micron posted record revenue, an 86.8% gross margin and above-consensus guidance on 30 September. The next session it was roughly flat. The number that matters is not the revenue — it is the 4.13% of price Micron now travels in an average day.