The G7 Is Releasing 100 Million Barrels. In March, 400 Million Didn't Cap the Price.
Reuters moved it just before 15:00 GMT on Friday: the G7 had agreed to release up to 100 million barrels of emergency oil and diesel reserves through the IEA. AP, the BBC, the Guardian, Politico and Euronews all had it within the hour. In the session that was still open when I pulled the data, ULSD heating oil was down roughly 3.3% against WTI's 1.6%. That gap — diesel taking close to twice the hit — is the whole story, and most of the commentary has it backwards.
What was actually agreed
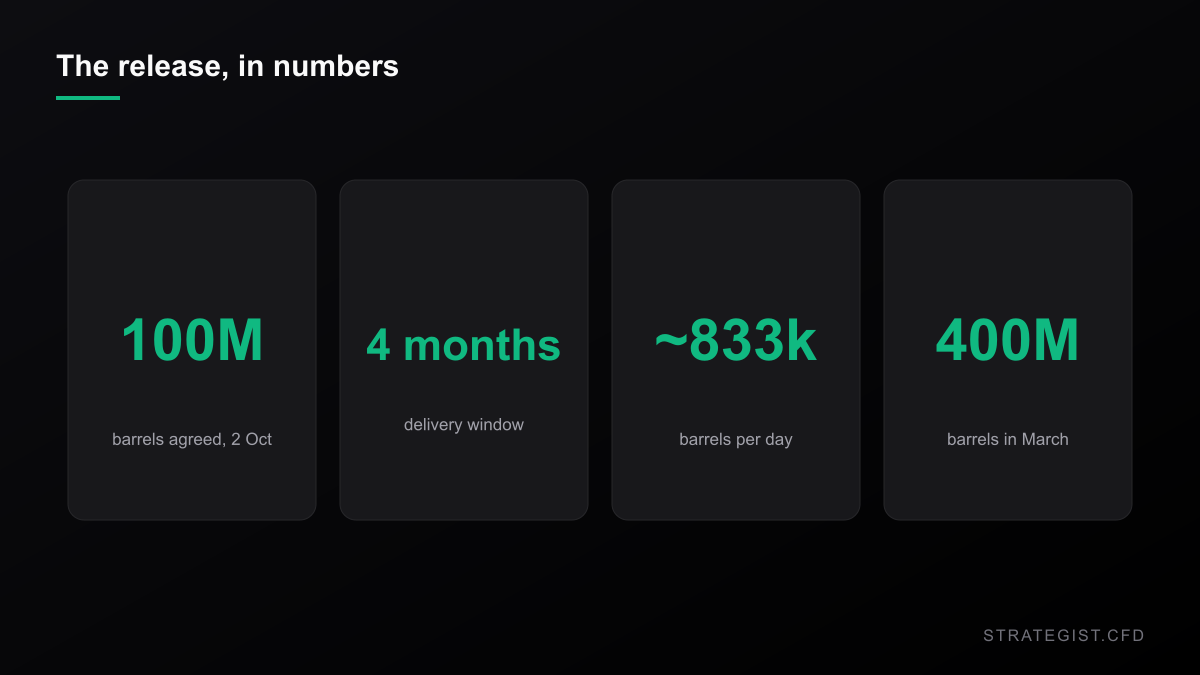
The release runs up to 100 million barrels, delivered through the IEA, spread over roughly four months, with the diesel front-loaded. It came after sustained pressure from Washington, which is why nearly every wire story carries some version of "after US pressure" in the second paragraph.
The framing detail that should shape everything else: this is the second coordinated release of 2026. On 11 March the IEA agreed to release a record 400 million barrels during the supply disruption that followed the Iran war — the largest emergency stock release ever assembled. Friday's number is a quarter of it.
Do the arithmetic and the entire policy is about 833,000 barrels a day for four months. Set against March, this is a smaller, narrower release aimed at a more specific bottleneck.
What the last 400 million barrels did
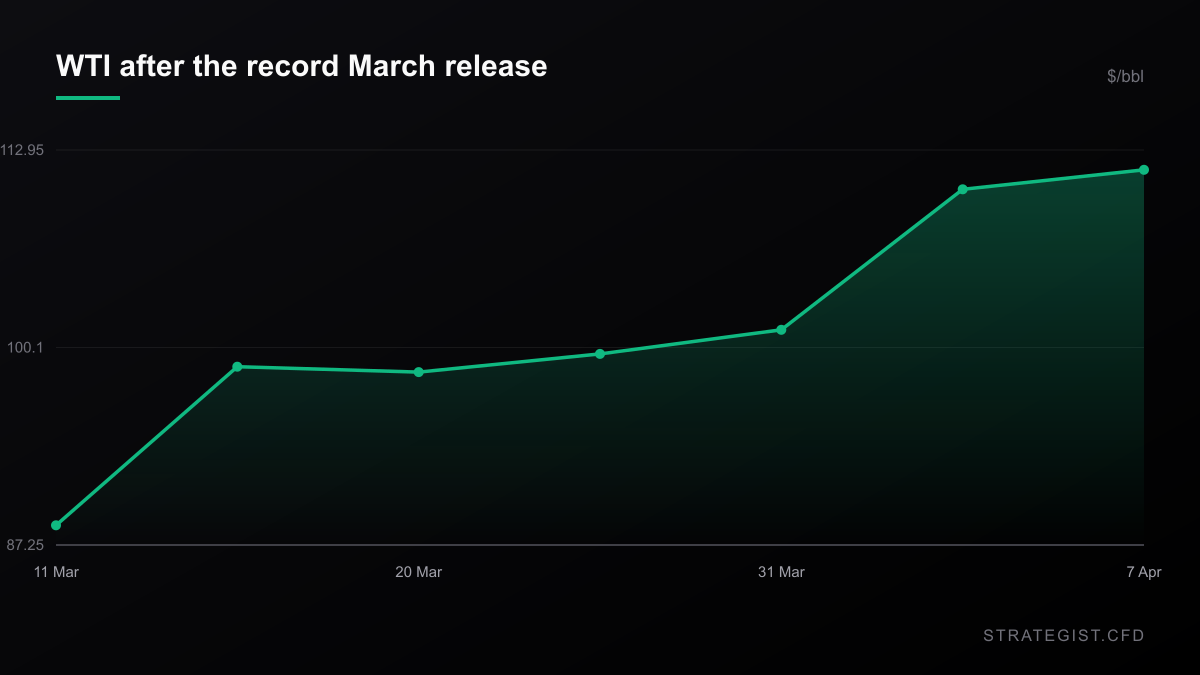
I pulled daily closes and measured the path. WTI closed at $87.25 on the day the IEA agreed the record release. Eighteen sessions later, on 7 April, it closed at $112.95 — the 2026 high. That is +29.5%. Brent did the same thing faster: $91.98 to $118.35 in fourteen sessions, +28.7%.
The largest release in the history of the mechanism did not cap the price. It didn't even slow it down for a month.
The honest reading isn't "releases are bullish." It's that a release is a supply addition of known size thrown against a deficit of unknown size. If the hole is bigger than the bucket, price does what the hole says. And nobody publishing a barrel count knows how big the hole is — which is precisely why the barrel count shouldn't be your trade.
This one is aimed at diesel, not crude
Front-loading diesel is an admission that the shortage sits in refined product rather than in crude, and the tape has been saying that for months.
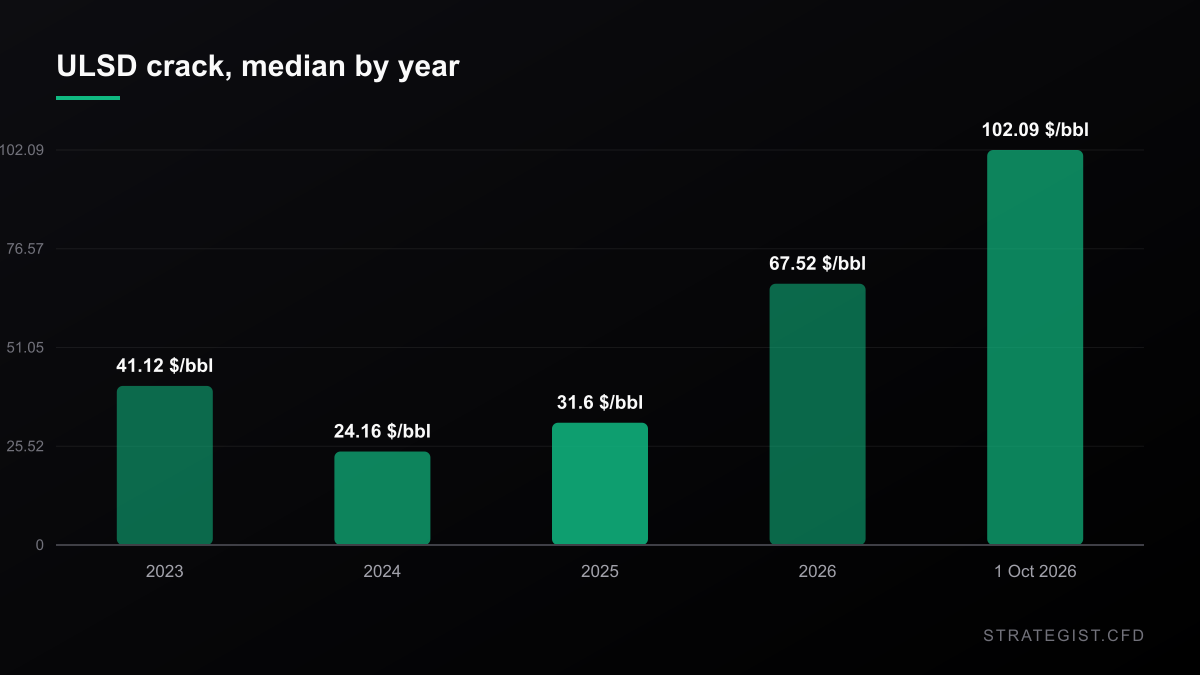
Here is the proxy I used: heating oil (HO=F) times 42, minus WTI. That gives the value of turning a barrel of crude into a barrel of diesel, in dollars per barrel. It is a 1:1 simplification, not a refinery's true 3:2:1 margin, and I say so everywhere I use it. Since January 2019 the median is $26.65. The 2025 median was $31.60. The 2026 median is $67.52. On 1 October it closed at $102.09, which is the 98.9th percentile of the entire seven-and-a-half-year sample. We wrote about the product side of this market when pump diesel broke $6 a gallon; the wholesale version of that problem hasn't gone away, it has got wider.
Diesel Just Broke $6 a Gallon. The Tradeable Part Is the Gap, Not the Pump.
US retail diesel passed $6 a gallon for the first time ever and the diesel crack cleared $100 a barrel. Here is why the spread is a better vehicle than the headline, and what it costs you in a CFD account.
Then there is Friday's divergence. Across the 332 sessions since 2019 where WTI fell 2% or more, the median diesel move was 0.76x the crude move. Friday was running at roughly 2.1x. When one leg of a complex starts moving at nearly three times its normal relative speed, that is where the information is. If you hold several energy positions at once, this is also the moment to actually measure how tightly they move together rather than assuming they do.
Correlation Matrix
Analyze the statistical relationship between different assets to avoid over-exposure.
The flat price is the wrong instrument
A release is a scheduled, sized flow into a particular delivery window. That is a curve event, not a spot event. The professional expression of it is the front-month against deferred: the barrels land on the nearby contract, and the trade is whether that flattens the backwardation.
A retail CFD account doesn't get the curve. You get a price that tracks the nearby contract plus a roll adjustment your broker chooses. You cannot express "the front softens relative to the back." What you can do is take a direction on the flat price, which is a different trade wearing the same headline.
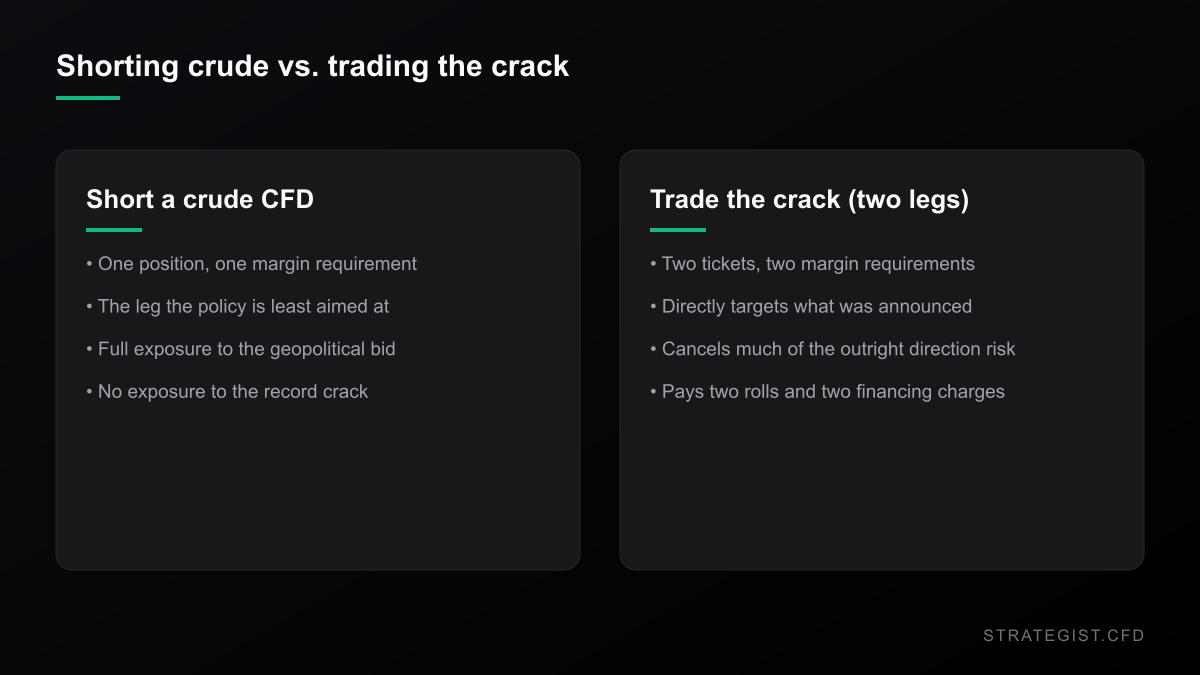
The structure that does map to the policy is the crack: long crude against short diesel, or the reverse. On a retail platform that means two tickets, two margin requirements, two overnight financing charges and two roll dates. On a $25,000 account with a 1% risk budget, that is $125 of risk per leg before a single night of carry is paid — and with short rates where they are, carry on a leveraged long held for weeks is a real line item, not rounding.
A two-sigma stop gets hit one time in four
Before sizing anything into this, look at what the tape is actually doing. Over the last 252 sessions WTI's daily standard deviation is 3.47%, and 27.4% of sessions moved 3% or more. Diesel is worse: 3.62% and 33.7%.
So I tested the stop. Using a rolling 20-day standard deviation, placing the stop at two of them, and then measuring the worst close over the following five sessions: across 1,693 occasions that stop was exceeded 26.5% of the time for WTI and 25.3% for diesel. No view needed, no news needed. Roughly one position in four, sized with a statistically defensible stop, is out within a week on drift alone.
That number should set your size. It usually doesn't.
What 1% of risk actually buys right now
$25,000 of equity, 1% at risk, so $250. A two-sigma stop on WTI at the current 20-day deviation is 5.65% of price — $5.24 a barrel. One WTI contract is 1,000 barrels, so $250 divided by $5,240 is 0.048 contracts. About $4,428 of notional, or 0.18x leverage.
That is the honest answer, and it is a small fraction of what retail accounts typically run. At 5x notional on the same account, a two-sigma adverse move costs 28.2% of equity. At 10x, 56.5%. Measured against the fatter 252-day deviation rather than the recent 20-day one, it's 34.7% and 69.4%. None of this is a forecast — it's arithmetic on volatility that is already in the tape.
Why Position Sizing Matters More Than Entry Signals
Entry signals decide where you trade; position sizing decides whether you survive. Why capital allocation dominates entry precision in leveraged CFD markets, and how to build a sizing rule you can actually follow.
How to trade a sized, scheduled release
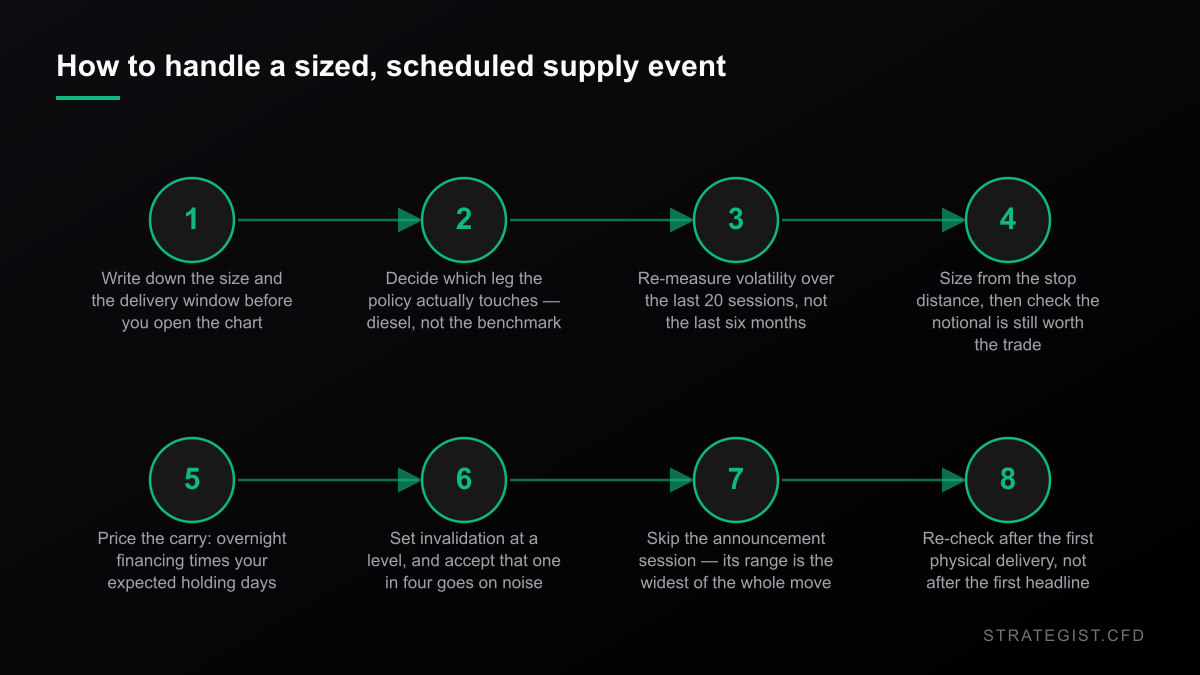
None of this is complicated, it's just rarely done in order. A release is a dated event, so the size should be decided before the date, not after the headline.
Risk Analyzer
Quantify event-specific risks and calculate potential impact on your portfolio.
Where I could be wrong
Four places, and none of them is minor.
n=2. There have been two coordinated releases this year, and the March one is badly confounded: the supply disruption was escalating at the same time. I can't separate "the release failed" from "the hole grew faster than the bucket." Any stronger claim than that isn't supported by what I measured.
The crack proxy is 1:1 with a single product. A real refinery margin includes gasoline, naphtha and fuel oil, and would move differently. Read $102 as "diesel is extremely expensive relative to crude," not as a refinery's profit per barrel.
The price series are continuous front-month futures and they roll. The first session of a month shows a median absolute move of 2.05% versus 1.41% on other sessions, and 1 October was a roll day — so part of the crack's fall from $117.77 on 30 September to about $97 on Friday may be mechanical rather than economic. Friday's own leg is cleaner, but that bar hadn't closed when I measured it.
And the big one: a crack at the 98.9th percentile is a statement about today, not about direction. Expensive spreads can stay expensive for months. Mean reversion is not a stop-loss, and "it can't stay here" has killed more accounts than any bad entry signal.
What to do on Monday
- If you're short energy on this headline, check which instrument first. If it's a crude benchmark, you are short the leg the policy is least aimed at.
- Size off the last 20 sessions' deviation, not off the last quiet month. The regime is different.
- Assume one stop in four gets taken out on noise, and confirm that's survivable before you place it.
- Price the overnight financing across your expected holding period before assuming a multi-week hold is free.
- Write the size and the delivery window on the chart. Both are public. That's the only edge on offer.
On method: prices are daily closes for CL=F, BZ=F and HO=F from Yahoo Finance, 2 January 2019 through 2 October 2026; the 2 October bar was still in progress and was excluded from every statistic. The percentages, standard deviations, the crack series and the stop-hit frequency were computed from that series in this repo. They are descriptive statistics of past prices — not a trading system and not a backtest.
Charts and analysis on this site are for research only and are not investment advice.
More in News
 News2026-10-01
Micron's Record Quarter Barely Moved the Stock. The Volatility Is the Story.
Micron posted record revenue, an 86.8% gross margin and above-consensus guidance on 30 September. The next session it was roughly flat. The number that matters is not the revenue — it is the 4.13% of price Micron now travels in an average day.
 News2026-09-30
Nasdaq Up 3%, Dow Down 3.5%: What a Split Month Does to Your Stop
Core PCE printed 3.0% against 3.3% expected, and the tape answered unevenly: Nasdaq 100 up, Dow down. September's gap between the two sits in the top 7% of months since 1992, and it changes the stop distance you should be using.
 News2026-09-29
Silver Is 47% Below Its January Peak. The Leverage Is an Illusion.
Silver fell 4.7% on Monday while gold fell 3.5%. I ran 6,539 sessions of COMEX data to see whether silver really is leveraged gold. It is 2.28x as volatile, but it only delivers about 1.35x on the days gold actually moves.