29,000 Jobs, a Record Nasdaq, and a 10-Year That Refused to Fall
Friday's tape, in numbers
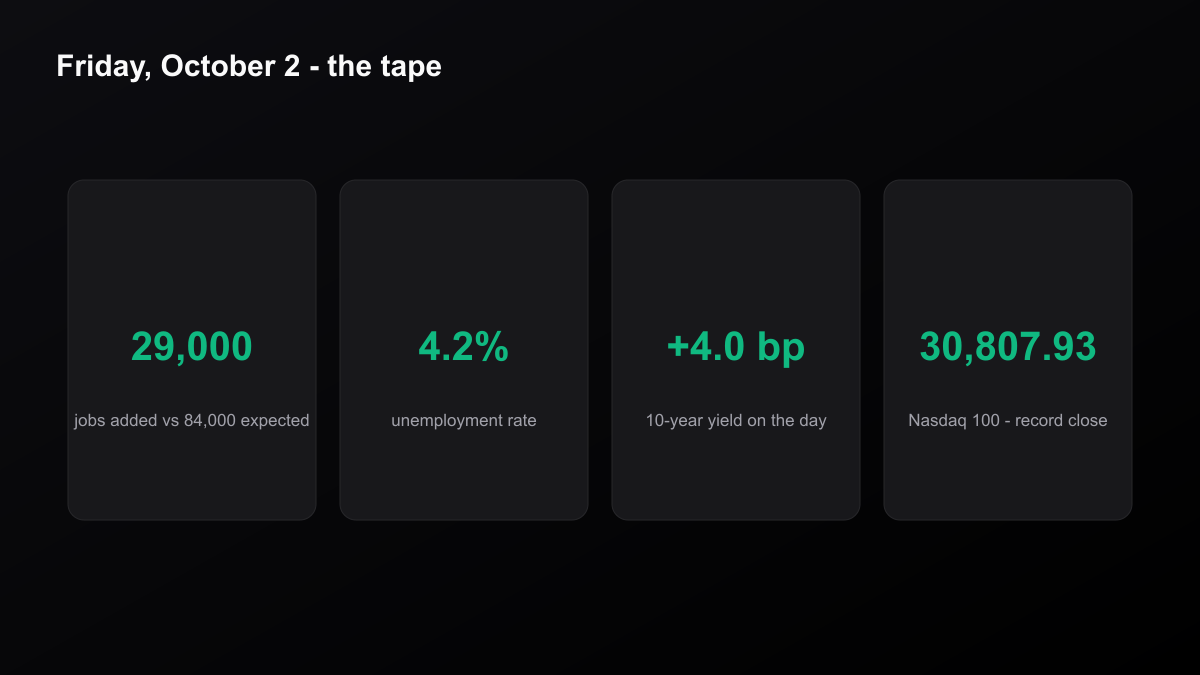
The September payrolls report landed at 8:30 a.m. Eastern and missed by a wide margin: 29,000 jobs added against a Dow Jones consensus of 84,000. Wages came in softer too — average hourly earnings rose 0.1% on the month, taking the annual rate to 3.0%, the lowest since May 2021. The unemployment rate ticked up to 4.2%.
Then the tape did something slightly odd. The Nasdaq 100 closed at 30,807.93, an all-time closing high. The Nasdaq Composite set an intraday record of 27,353.68 before finishing at 27,190.86. The S&P 500 gained 0.73% to 7,722.72. And the 10-year Treasury yield went up — 4 basis points to 5.277%, roughly a basis point below its 52-week high.
That combination is the whole story. A soft labour print, an equity rally, and a long end that would not budge.
The report said two different things
Payrolls come from two surveys, and in September they disagreed. The establishment survey — the one that produces the 29,000 headline — also revised August down to 133,000 and flipped July from a gain to a loss of 10,000. Net revision: 60,000 fewer jobs than previously reported.
The household survey, which is where the unemployment rate comes from, looked nothing like that. Household employment rose 406,000. The labour force grew by 485,000, and participation rose 0.2 points to 61.8%, the highest since May. The broad underemployment measure fell to 7.6%, its best since January 2025.
Read together, the unemployment rate did not rise because people lost jobs. It rose because more people showed up looking for them. That is a different economy from the one the headline implies, and it is why Fed officials — who watch the jobless rate more closely than the payroll count — may not read Friday's print the way equity traders did.
The front end listened. The back end didn't.
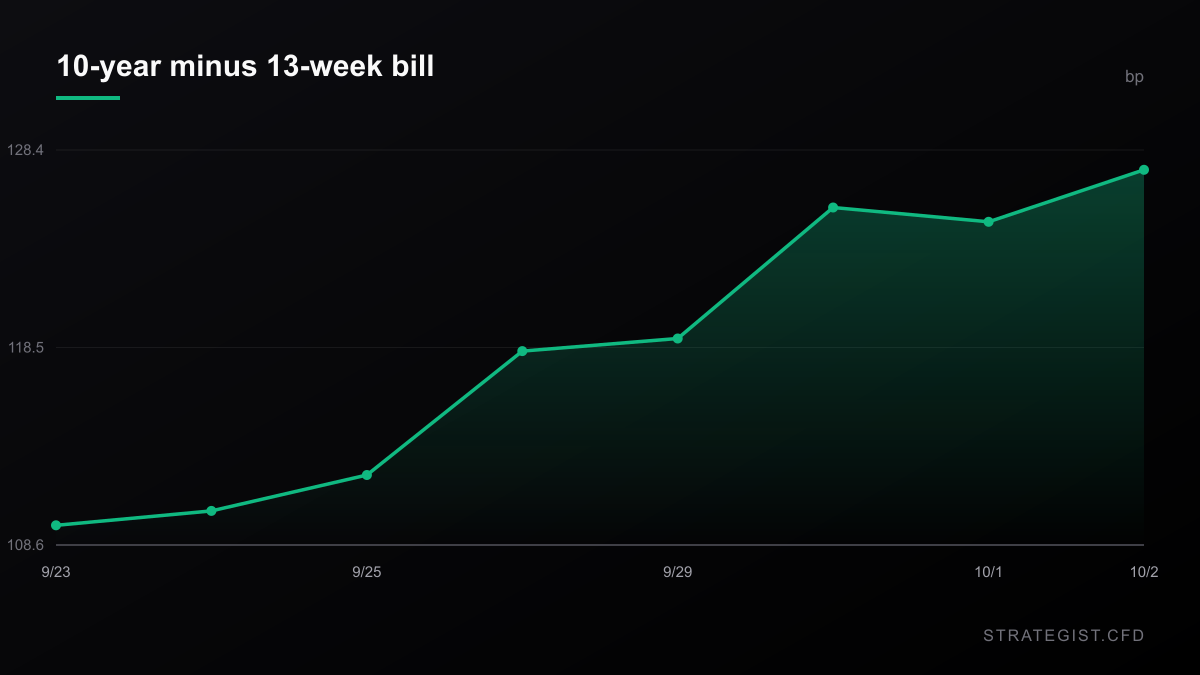
Here is the part that matters if you hold anything overnight. The 13-week bill yield fell 7.7 basis points over the week to 3.993%, and market-implied odds of a hold at the October 27–28 meeting jumped to 82.8% on CME's FedWatch tool. The front end priced the October hike out.
The 10-year did the opposite: up 9.3 basis points on the week. The gap between them — 10-year minus 13-week — widened to 128.4 basis points from 111.4 a week earlier. That is the steepest the curve has been since 1 July 2022. Through 2023 and 2024 this spread spent most of its time negative; the median was minus 107 basis points in 2023 and minus 90 in 2024. It is 80.5 so far this year.
Why that matters for a CFD account: overnight financing is priced off the short end, discount rates off the long end. Friday handed you a slightly cheaper carry and an unchanged — arguably tighter — valuation backdrop. The long end is still not buying the idea that the inflation problem is solved, and core inflation is running at 3%.
A record Nasdaq, and a Dow 5.8% below its high
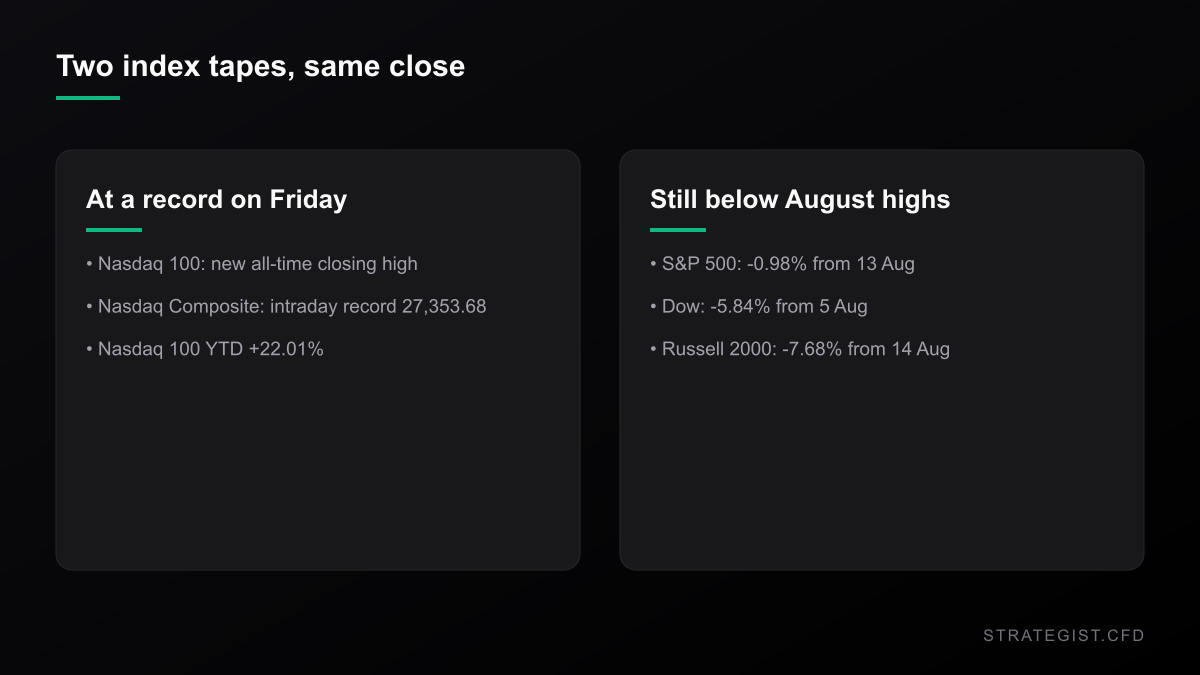
The record is real but it is narrow. The Dow closed Friday 5.84% below its 5 August record of 54,349.12. The Russell 2000 is 7.68% below its 14 August high. The S&P 500 sits 0.98% below its 13 August close. Of those four indices, only the Nasdaq 100 is at a new high.
Year to date the gap is starker: Nasdaq 100 +22.01%, Dow +6.48%. If you are long an index CFD because the market is strong, be clear about which market you are actually long. A US30 position and a NAS100 position were not the same trade on Friday, and they have not been since August.
I checked what a rally with rising yields actually precedes
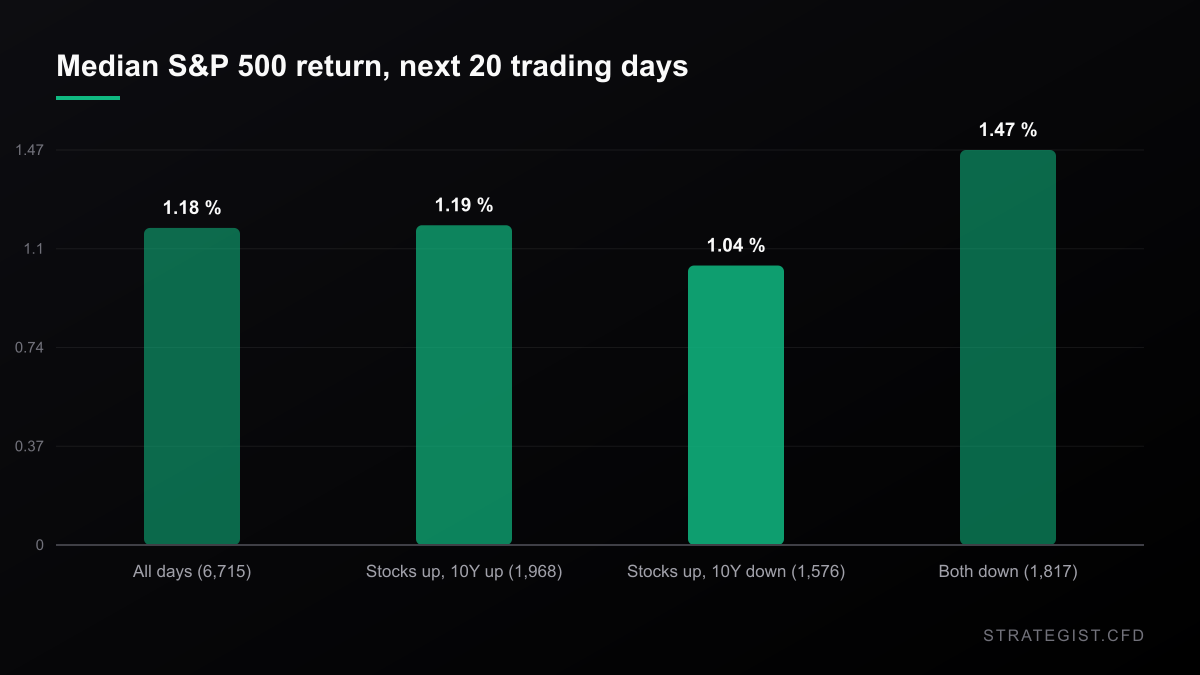
It is tempting to read Friday as a warning: stocks cheering bad news while the long end refuses to cooperate. So I measured it. Using daily closes from January 2000 through Friday (6,715 observations), I split every session by the sign of the S&P 500 return and the sign of the change in the 10-year, then looked at what happened next.
On the 1,968 days when stocks rose and the 10-year rose with them, the median S&P gain over the next 20 trading days was 1.19%, with 63.1% of those windows closing higher. The unconditional baseline for all days: 1.18% and 63.1%. Over five days the up-and-up group actually did marginally worse than average — 0.27% against 0.31%.
Tightening it to days when the S&P gained at least 0.5% and the 10-year rose at least 3 basis points (685 days) changed nothing useful: 0.18% over five days with a 53.7% hit rate, against 0.31% and 57.2% for all days. The honest reading is that this combination is not a signal. It is a description of one afternoon.
One thing did stand out, though. 2026 has been an unusually low year for this pattern. Across the whole sample, 54.6% of up-days in the S&P also had a rising 10-year. This year it is 41.8%, the lowest of any year since 2000. For most of 2026, stocks and long yields moved in opposite directions. Friday was one of the minority days, which is a decent argument for treating it as noise rather than a regime change.
Payroll Friday is bigger than your stop thinks
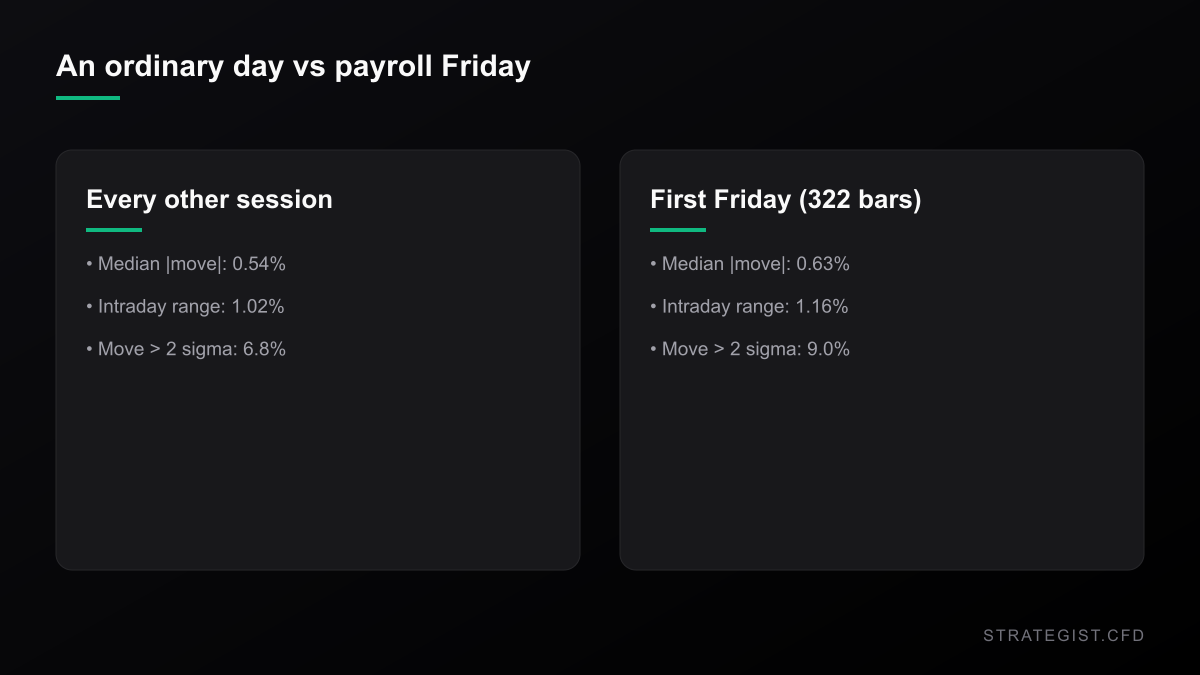
None of this means you ignore the calendar. Payroll morning is genuinely a different volatility environment, and the numbers are not subtle.
I used the first Friday bar of each month as a proxy for payroll day — 322 sessions. It is an approximation: when the first Friday falls on a market holiday, as it did in April and July this year, the proxy lands a week late, and BLS occasionally shifts the release too. Median absolute move on those days: 0.63%, against 0.54% on everything else. Intraday high-to-low range: 1.16% versus 1.02%. And a close-to-close move larger than two standard deviations of the previous 20 days happened on 9.0% of them, against 6.8%.
Now put that next to a stop. Two standard deviations of the S&P current 20-day daily volatility is 1.27%. On the Nasdaq 100 it is 1.93%. A $25,000 account risking 1% — $250 — can carry about $19,700 of S&P exposure at that stop distance, or 0.79x leverage. The same dollar risk on the Nasdaq 100 buys $12,950, or 0.52x. That is the whole position.
And a two-sigma stop is not as safe as it sounds. Over the full sample, a stop placed two standard deviations below the close got touched within five trading days 33.8% of the time, and within ten days 47.0% of the time. Roughly one entry in three is stopped out by ordinary noise before the idea has time to work, and payroll week is exactly when ordinary noise runs larger than your backtest assumed.
One more thing worth knowing before you fade the pop. On the 88 payroll-proxy days when the S&P gained 0.7% or more, the next session median return was minus 0.04% with only 46% closing higher, but over the following 20 days the median was +1.61% with 66.7% positive. There was no reliable give-back to short. The correlation between the payroll-day move and the next five days was minus 0.109 — mildly mean-reverting, nowhere near tradeable on its own.
Where I could be wrong
Three ways, at least. First, the payroll proxy is crude: BLS shifts release dates and my holiday handling is wrong in a few months, so the volatility comparison is a reasonable estimate, not a precise measurement. Second, the forward-return study is unconditional. It knows nothing about valuations, earnings season or where the index sits in its range, and a 20-day window that lands inside a strong tape will flatter any condition you pick. Third, and most important, this whole piece assumes the reaction function is stable. It is not. If the next CPI print runs hot, the same soft labour data stops being good news in about fifteen minutes, and the long end — which never bought the pivot — turns out to have been right.
There is a simpler failure mode too. I am reading a lot into one afternoon cross-asset split. Six thousand observations say the split carries no forward edge. I still think it is worth understanding, because it tells you what each market is pricing. Just do not confuse that with a trade.
What to do with it
- Know which leg of the curve your cost comes from. Overnight financing tracks the short end, which eased this week: the 13-week bill at 3.993% plus a typical broker markup of around two points is roughly 6% a year on notional. At 5x notional that is about 30% of account equity per year, and it does not care whether your thesis is right.
- Size for the calendar, not the average day. If Friday median move is 0.63% and your stop is 1.27% wide, you are two payroll days from being stopped out. Either widen the stop and cut the size, or stay flat through 8:30 a.m.
- Check what you are actually long. A record Nasdaq 100 and a Dow 5.8% off its high are not one market. If you hold more than one index CFD, run them through a correlation check before assuming you are diversified.
Correlation Matrix
Analyze the statistical relationship between different assets to avoid over-exposure.
Size the position before you form the opinion. That is the part that survives being wrong about the Fed.
Risk Analyzer
Quantify event-specific risks and calculate potential impact on your portfolio.
The one thing this week actually changed: October 27–28 is now very likely a non-event, at 82.8% odds of a hold. That pushes the risk to December, and to the CPI prints in between.
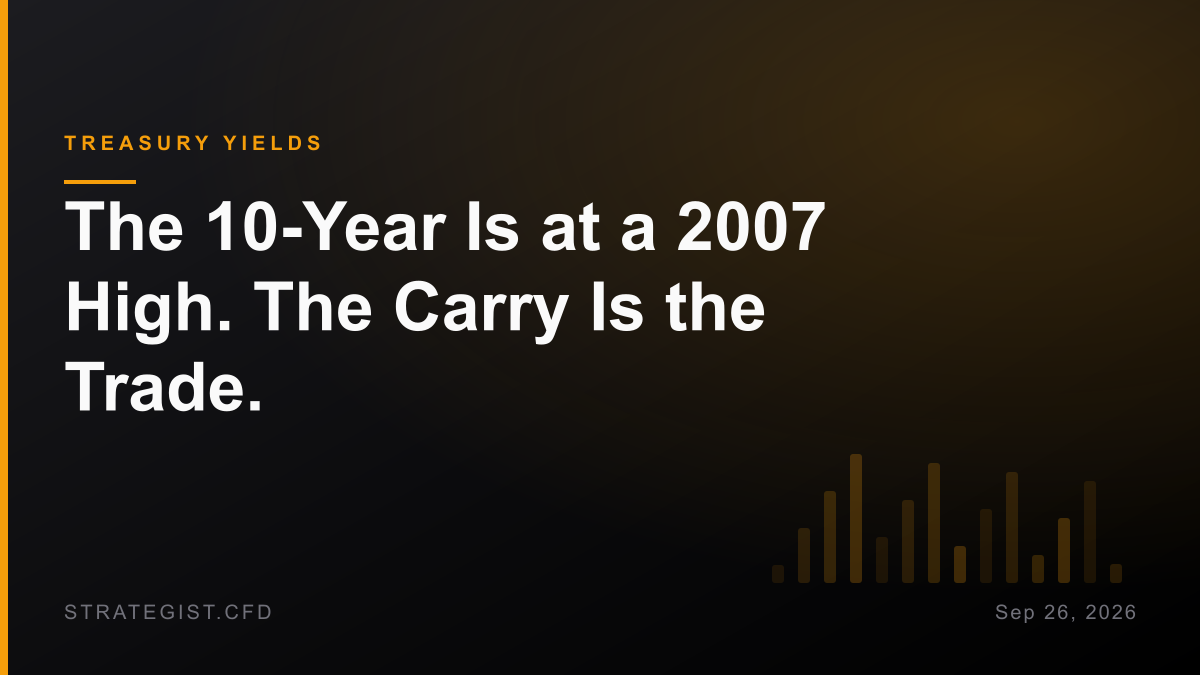
The 10-Year Is at a 2007 High. The Carry Is the Trade.
The 10-year Treasury closed at 5.184%, the highest since July 2007 — and the S&P still finished the week up 1.21% with the VIX under 15. The stock-bond correlation has flipped sign since 2007, and the part of that which is not a forecast is the carry: it eats a forex setup's 0.6R target in about thirteen days.
Charts and analysis on this site are for research only and are not investment advice.
More in News
 News2026-10-02
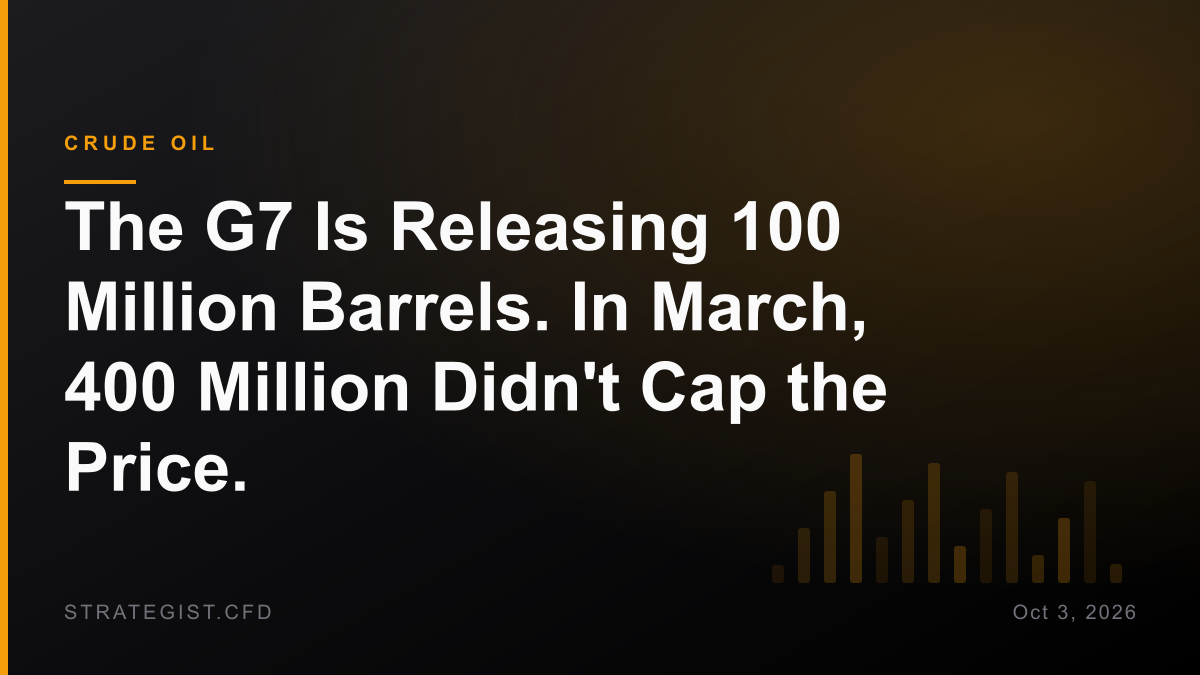
The G7 Is Releasing 100 Million Barrels. In March, 400 Million Didn't Cap the Price.
The G7 agreed to release up to 100 million barrels of diesel and crude through the IEA. In March a record 400 million didn't cap anything — WTI put on 29.5% over the following 18 sessions. What is actually tradeable here is the diesel crack, and it sits at the 98.9th percentile.
 News2026-10-01
Micron's Record Quarter Barely Moved the Stock. The Volatility Is the Story.
Micron posted record revenue, an 86.8% gross margin and above-consensus guidance on 30 September. The next session it was roughly flat. The number that matters is not the revenue — it is the 4.13% of price Micron now travels in an average day.
 News2026-09-30
Nasdaq Up 3%, Dow Down 3.5%: What a Split Month Does to Your Stop
Core PCE printed 3.0% against 3.3% expected, and the tape answered unevenly: Nasdaq 100 up, Dow down. September's gap between the two sits in the top 7% of months since 1992, and it changes the stop distance you should be using.